# Real-time run logs
## Introduction
When a process flow is running, the `logs` panel provides real-time information about the progress of each step. This is a great way to monitor what's happening during each step of the flow.
## Working with real-time logs
Show me

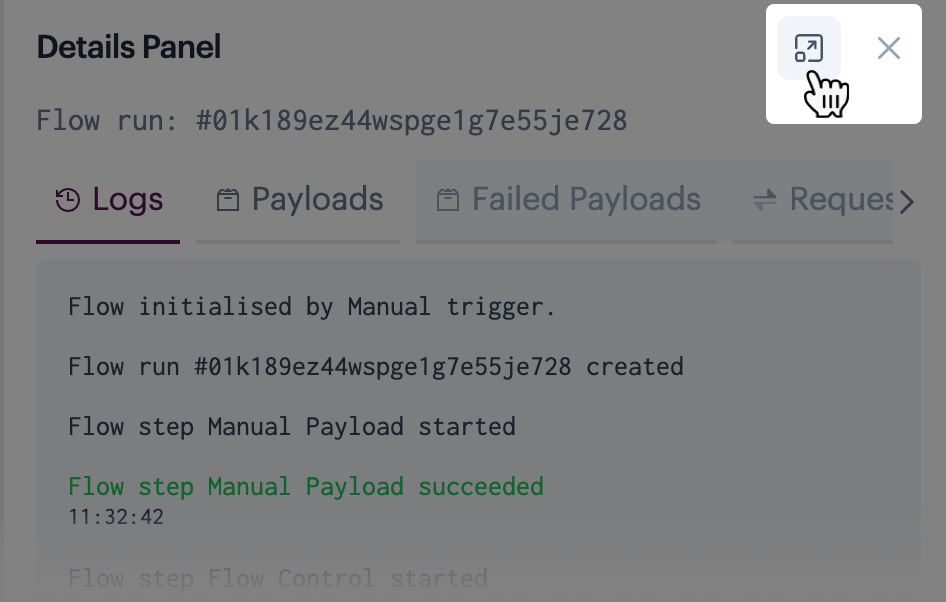
As a flow progresses, click the 'tick' icon for a shape to view information for that step - for example:
You can drag this panel anywhere on the canvas. If you prefer to work with a larger window, click the 'pop-out' icon:
## Log details
Details are provided over a series of tabs:
* [Logs](#logs)
* [Payloads](#payloads)
* [Failed payloads](#failed-payloads)
* [Requests](#requests)
* [Responses](#responses)
* [Metadata](#metadata)
### Logs
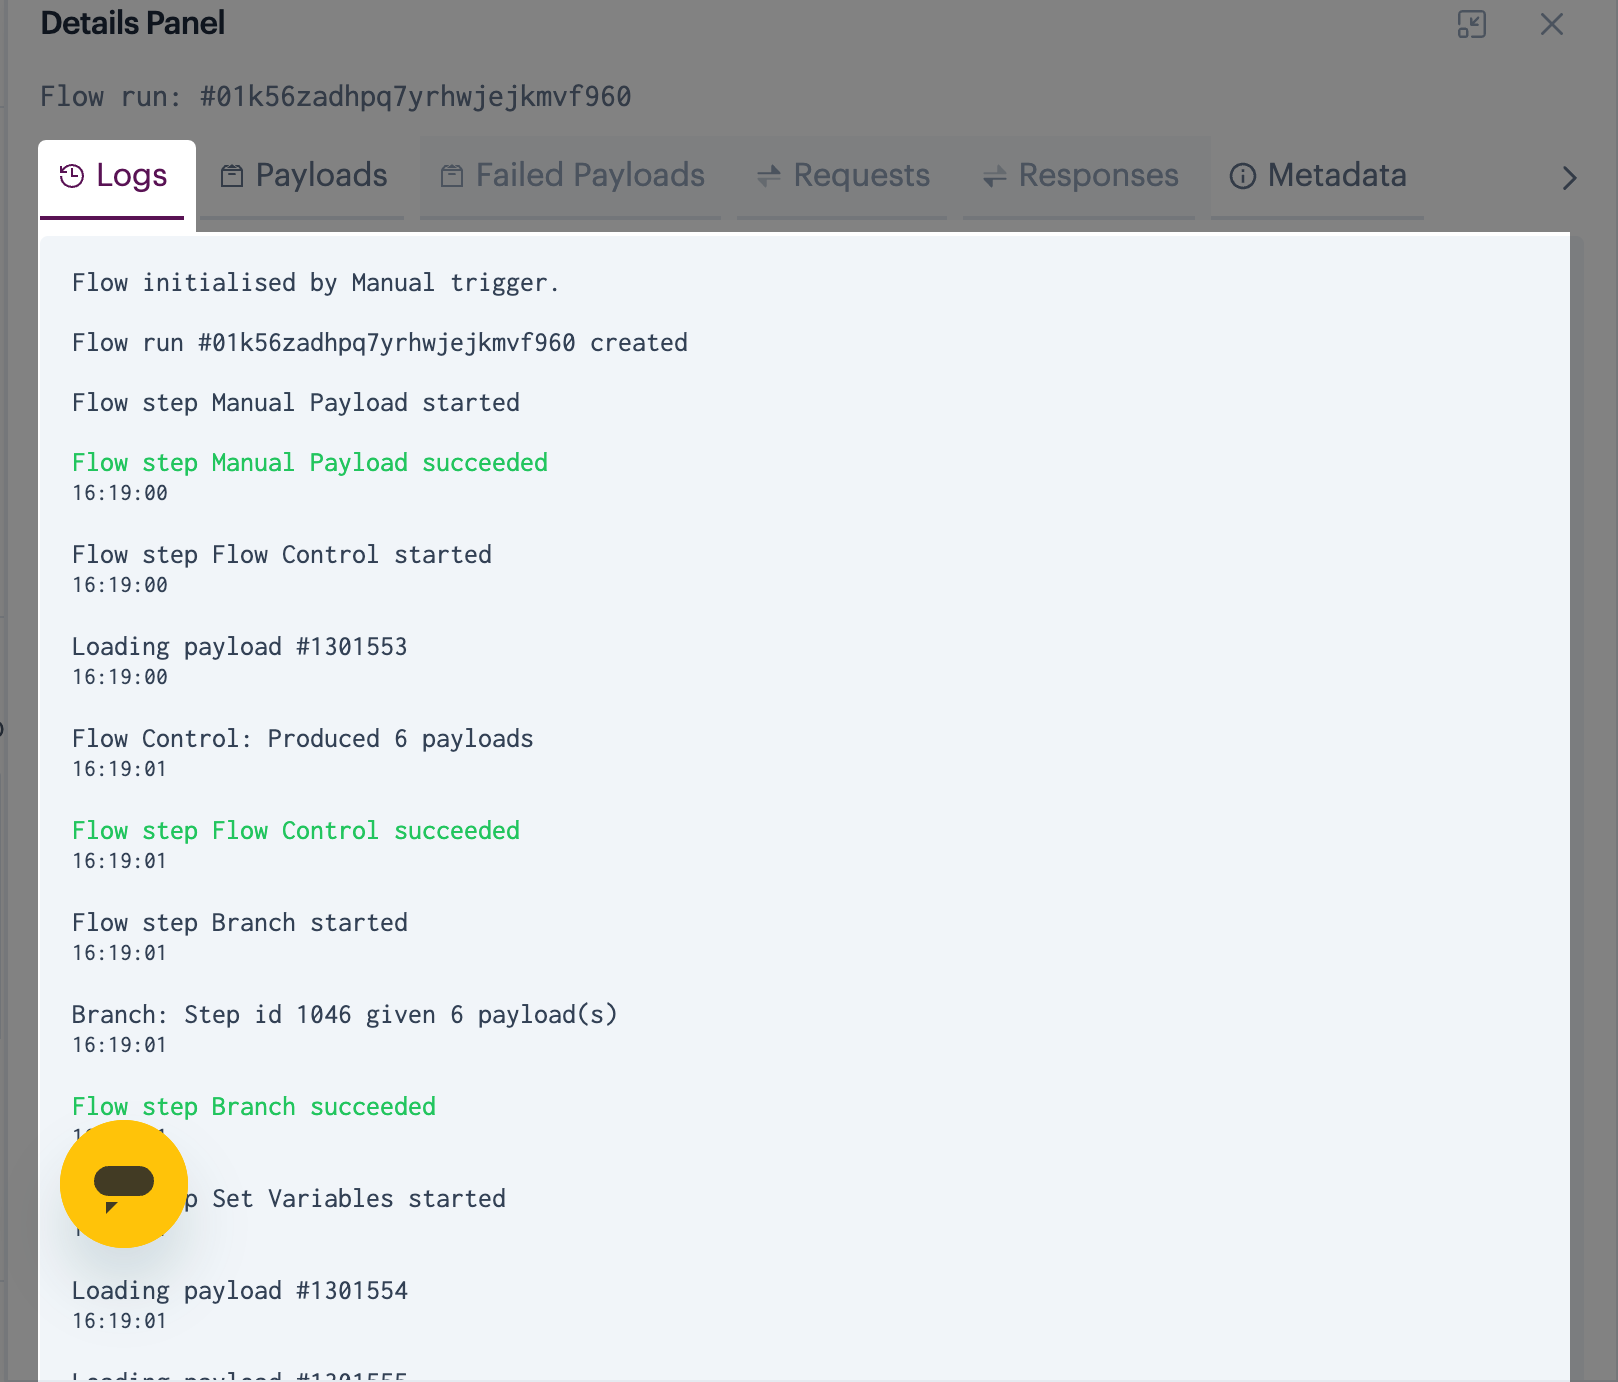
The `logs` tab provides a commentary about the status of the process flow as it progresses through each step - for example:
{% hint style="info" %}
Look out for warnings displayed in different colours:
* Orange: warning
* Red: error
* Blue: [virtual environment](https://doc.wearepatchworks.com/product-documentation/virtual-environments) replacement swap
{% endhint %}
### Payloads
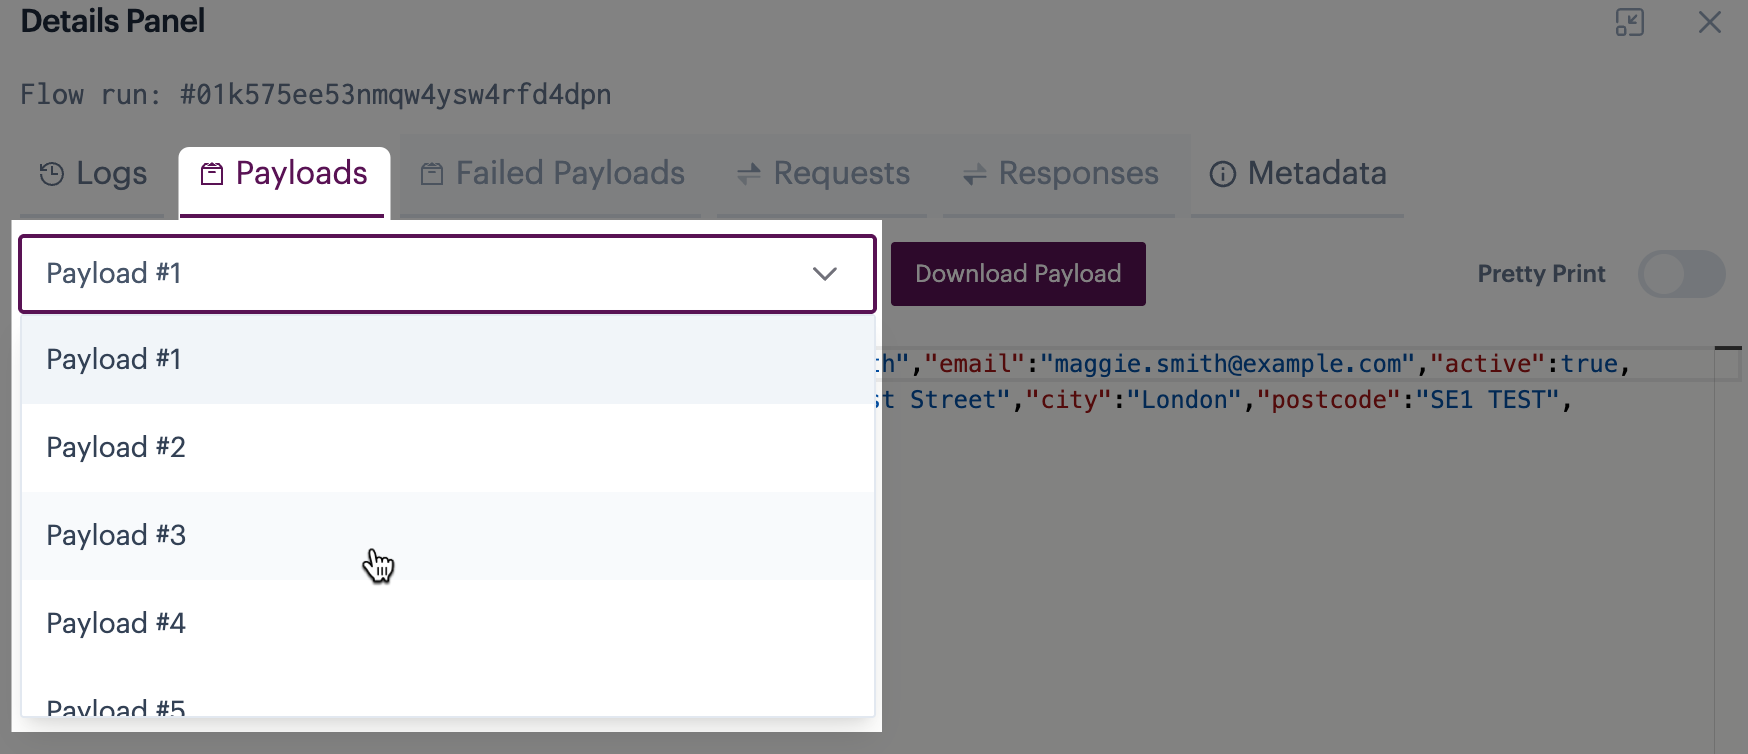
The `payloads` The tab shows the payload for the selected step in the process flow, so you can see exactly what has happened to your data at every stage. For example:
If a shape generates multiple payloads (for example, where a [flow control shape](https://doc.wearepatchworks.com/product-documentation/process-flows/building-process-flows/process-flow-shapes/standard-shapes/flow-control-shape) batches data into smaller payloads, or if incoming data is paginated), you can choose which one to view - for example:
{% hint style="info" %}
You can use the `pretty print` option to format the payload in a more readable form. A `download` option is also available, so you can save failed payloads locally (for example, you might want to amend any data issues and send the amended version into a 'sweeper' process flow via the [manual payload](https://doc.wearepatchworks.com/product-documentation/process-flows/building-process-flows/process-flow-shapes/standard-shapes/manual-payload-shape) shape).
{% endhint %}
{% hint style="info" %}
If a payload is too large to display, it is trimmed, and a `download` option is available for offline viewing.
{% endhint %}
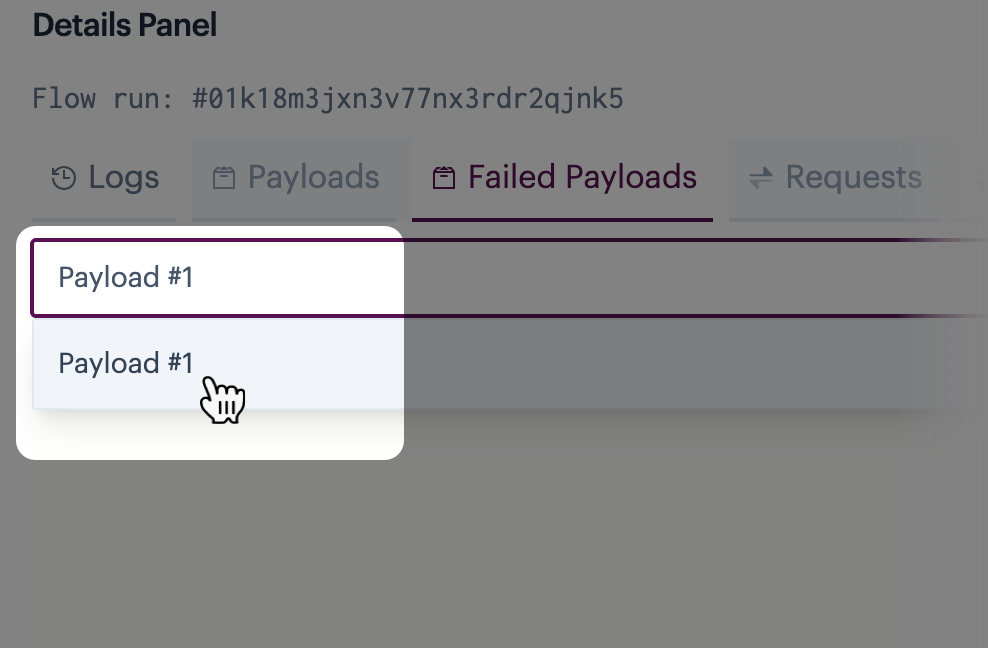
### Failed payloads
If the [remove failed payloads](https://doc.wearepatchworks.com/product-documentation/building-process-flows/process-flow-settings#understanding-process-flow-settings) option is toggled `on` in [process flow settings](https://doc.wearepatchworks.com/product-documentation/process-flows/building-process-flows/process-flow-settings) OR a [try/catch shape](https://doc.wearepatchworks.com/product-documentation/process-flows/building-process-flows/process-flow-shapes/standard-shapes/try-catch-shape) has found exceptions, this tab displays any payloads that were removed in this run:
{% hint style="info" %}
You can use the `pretty print` option to format the payload in a more readable form. A `download` option is also available, so you can save failed payloads locally (for example, you might want to amend any data issues and send the amended version into a 'sweeper' process flow via the [manual payload](https://doc.wearepatchworks.com/product-documentation/process-flows/building-process-flows/process-flow-shapes/standard-shapes/manual-payload-shape) shape).
{% endhint %}
If multiple payloads are removed, you can choose which one to view - for example:
{% hint style="info" %}
Failed payloads are added to a 'payload metadata' object, together with error information. You can view this from the [metadata](#metadata) tab.
{% endhint %}
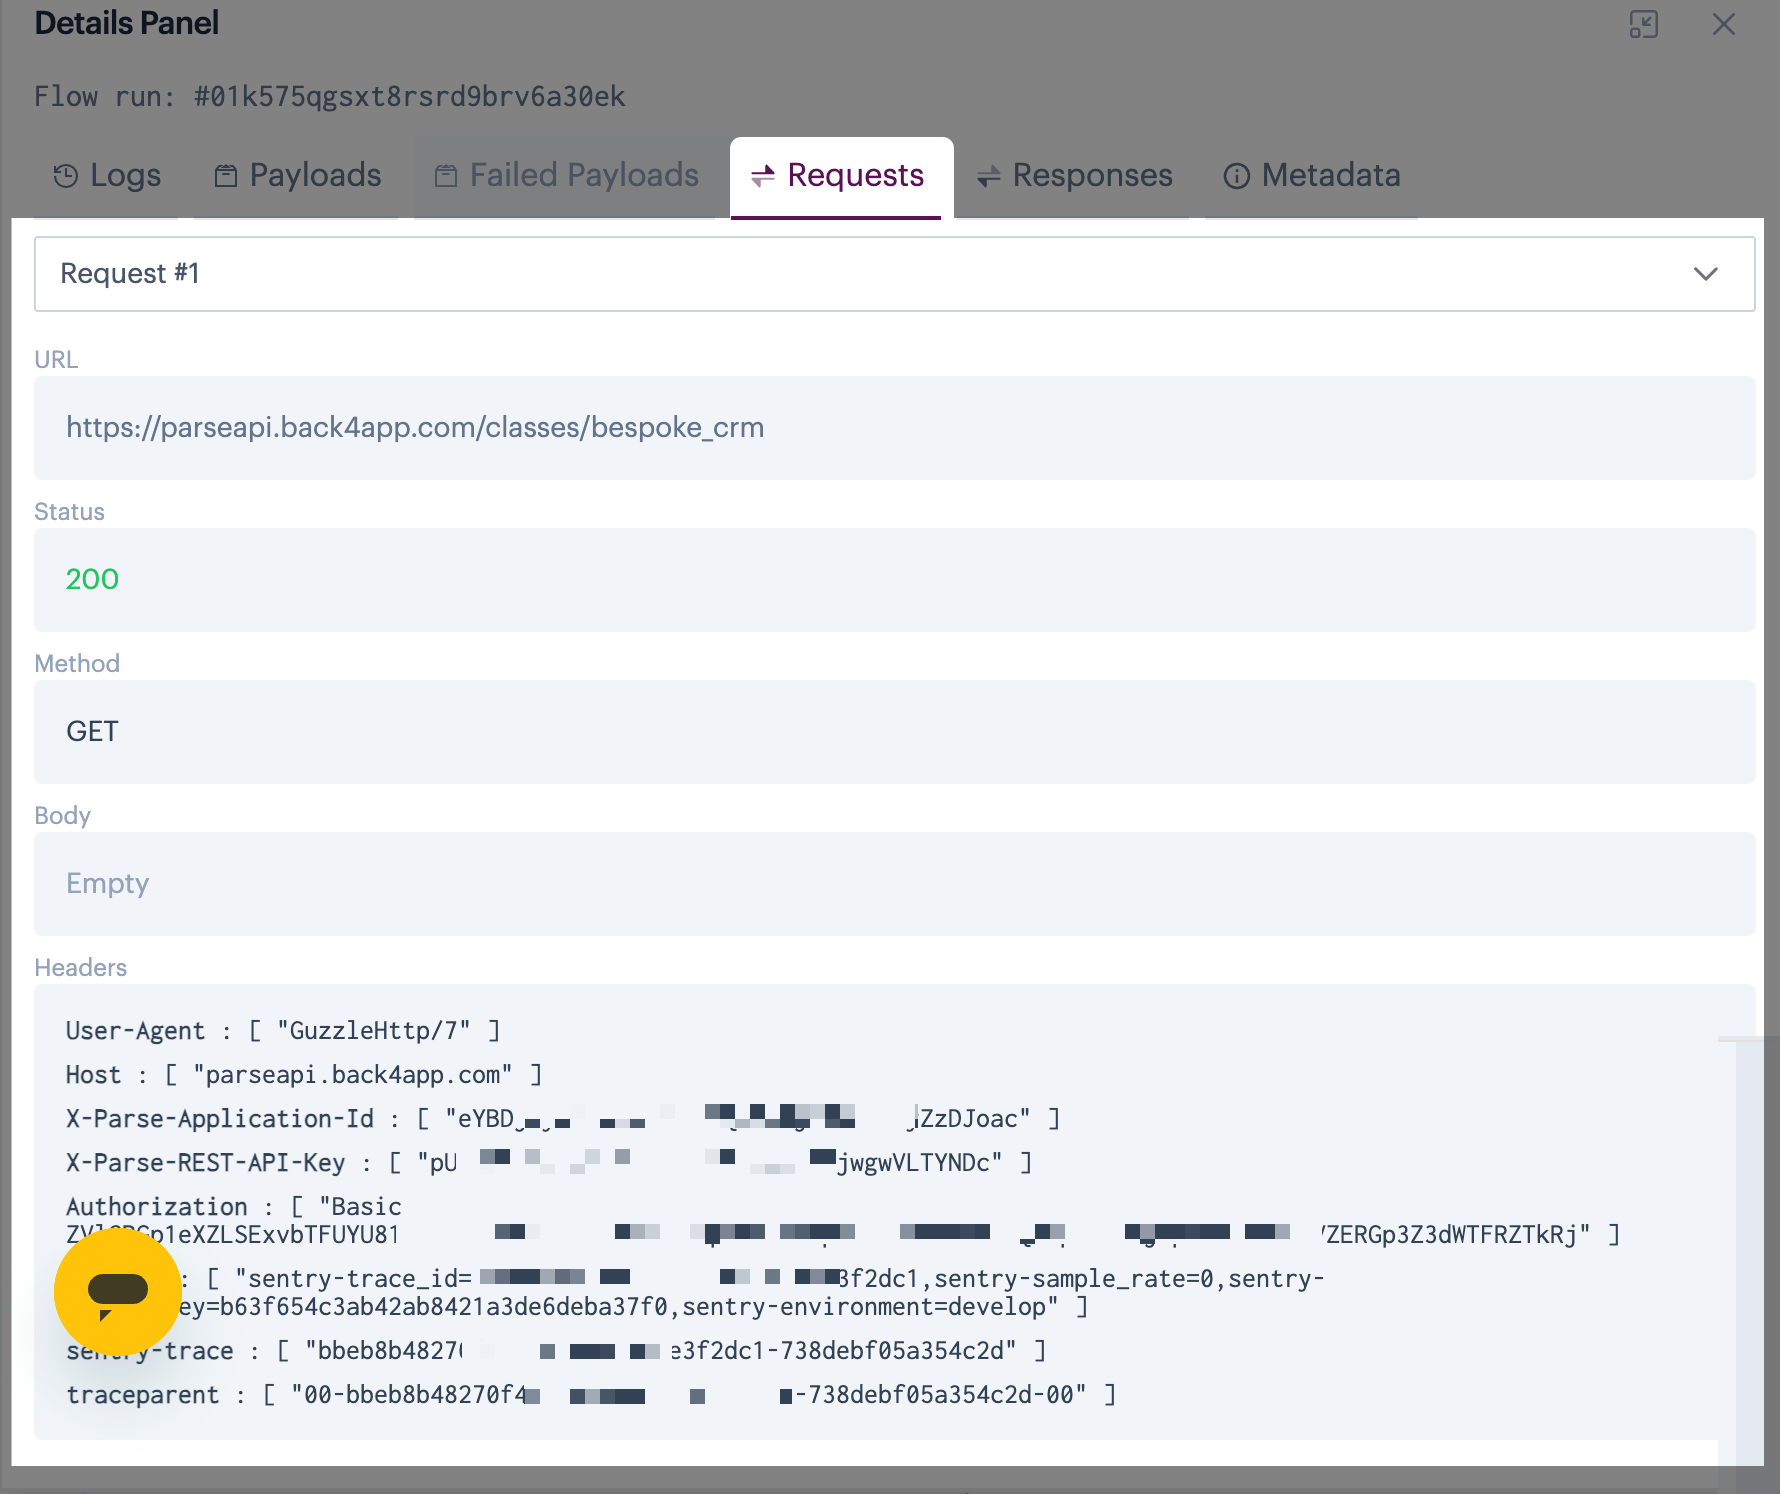
### Requests
The `requests` tab shows details of the API request made for the selected shape - for example:
Here you can see the API request `URL`, `method`, `body` content and `headers`. If multiple requests are made (for example, if a connection fails the first time) you can use the request dropdown list to view each one.
### Responses
The `responses` tab shows details of the API response received for the selected shape - for example:
Here you can see the API response `status`, `body` content and `headers`. If multiple responses are received, you can use the response dropdown list to view each one.
### Metadata
The `metadata` tab shows payload metadata for the selected shape - for example:
Here, you can see metadata associated with payloads for the give step (via a [script](https://doc.wearepatchworks.com/product-documentation/process-flows/building-process-flows/process-flow-shapes/advanced-shapes/script-shape) or the [set variables](https://doc.wearepatchworks.com/product-documentation/process-flows/building-process-flows/process-flow-shapes/standard-shapes/set-variables-shape) shape).
If incoming payloads are received via a connector, you'll find connection information before the metadata. For example:
{% hint style="info" %}
If a run includes [failed payloads](#failed-payloads), you'll find the failed payload here, together with error information. If the payload exceeds the maximum number of characters allowed (5000), the error message content is truncated. In rare cases, it may also be necessary to truncate the payload element. [Run logs](https://doc.wearepatchworks.com/product-documentation/process-flows/error-reporting-and-exception-handling/run-logs-and-queue) indicate where data was truncated.
{% endhint %}
 Show me