The process flows overview page

Introduction

The process flow home/overview page shows process flow summary information and your latest run logs:

If you only use process flows to sync data, this will be your default 'home' page when you access the Patchworks dashboard. If you use services to sync data but you're experimenting with process flows, you'll find this information in the left-hand navigation bar - select process flows > overview.

The dashboard is split into three panels:

Process flow stats

Process flow statistics show the operational status of current process flows for the last 24 hours, at a glance:

The following statistics are available:

Statistic
Summary

Active flows

The number of process flows within your company profile which are enabled.

Average runtime

The average time required to run and complete a process flow (based on successful runs).

Successful flow runs

The number of process flows that have started and not failed during the last 24 hours. Click this block to access retrospective run logs. This number excludes runs that have completed with partial success.

Failed flow runs

The number of process flows that have started and failed during the last 24 hours. Click this block to access retrospective run logs.

Records chart (tracked data)

The records chart shows the number of operations tracked records processed for the selected period:

Choose a time period You can use the time period selector to choose which records to view:

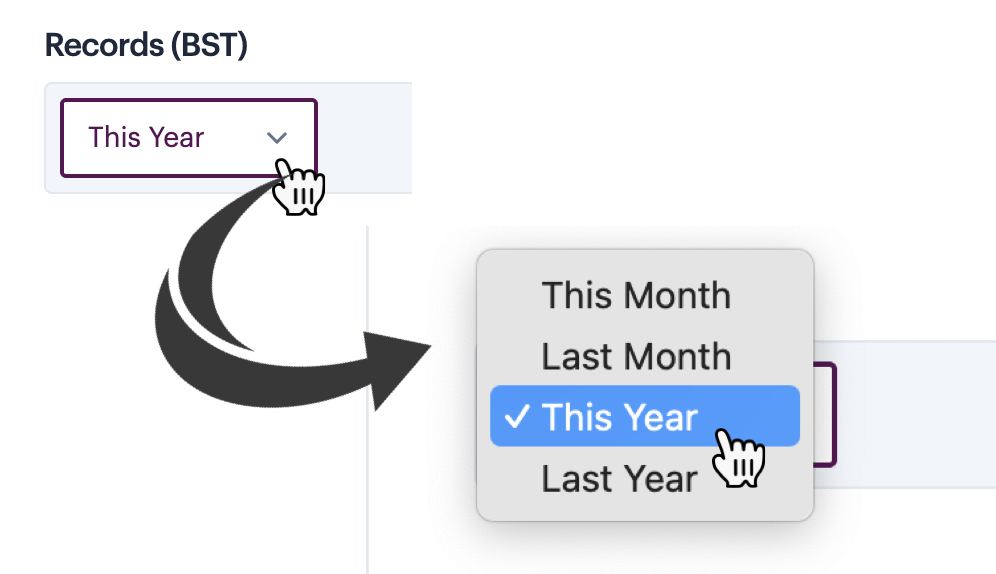
Choose the data direction to view You can choose to view inbound (received) operations or outbound (sent) operations:

View details Hover your cursor over any point to view operation details:

Run logs

Standard run logs are displayed in the lower panel. Here you can see run logs for the last seven days, with options to access the process flow and/or detailed logs and payloads:

Please see our Run logs & queue section for further information about working with this panel.

Last updated