Service sync logs
Introduction
Each time that a service runs, logs are generated. These logs can be useful for diagnosing a problem with a service, or when handling sync queries.
You can choose to view summary logs for a quick snapshot of the sync status, or you can access detailed logs to view full sync history...you can even watch a sync happening in real time!
Accessing sync summary information for a service
For any service, you can view summary details for every sync (i.e. service run) that has started in the last 24 hours. To view this information, follow the steps below: Step 1 Access the services list:
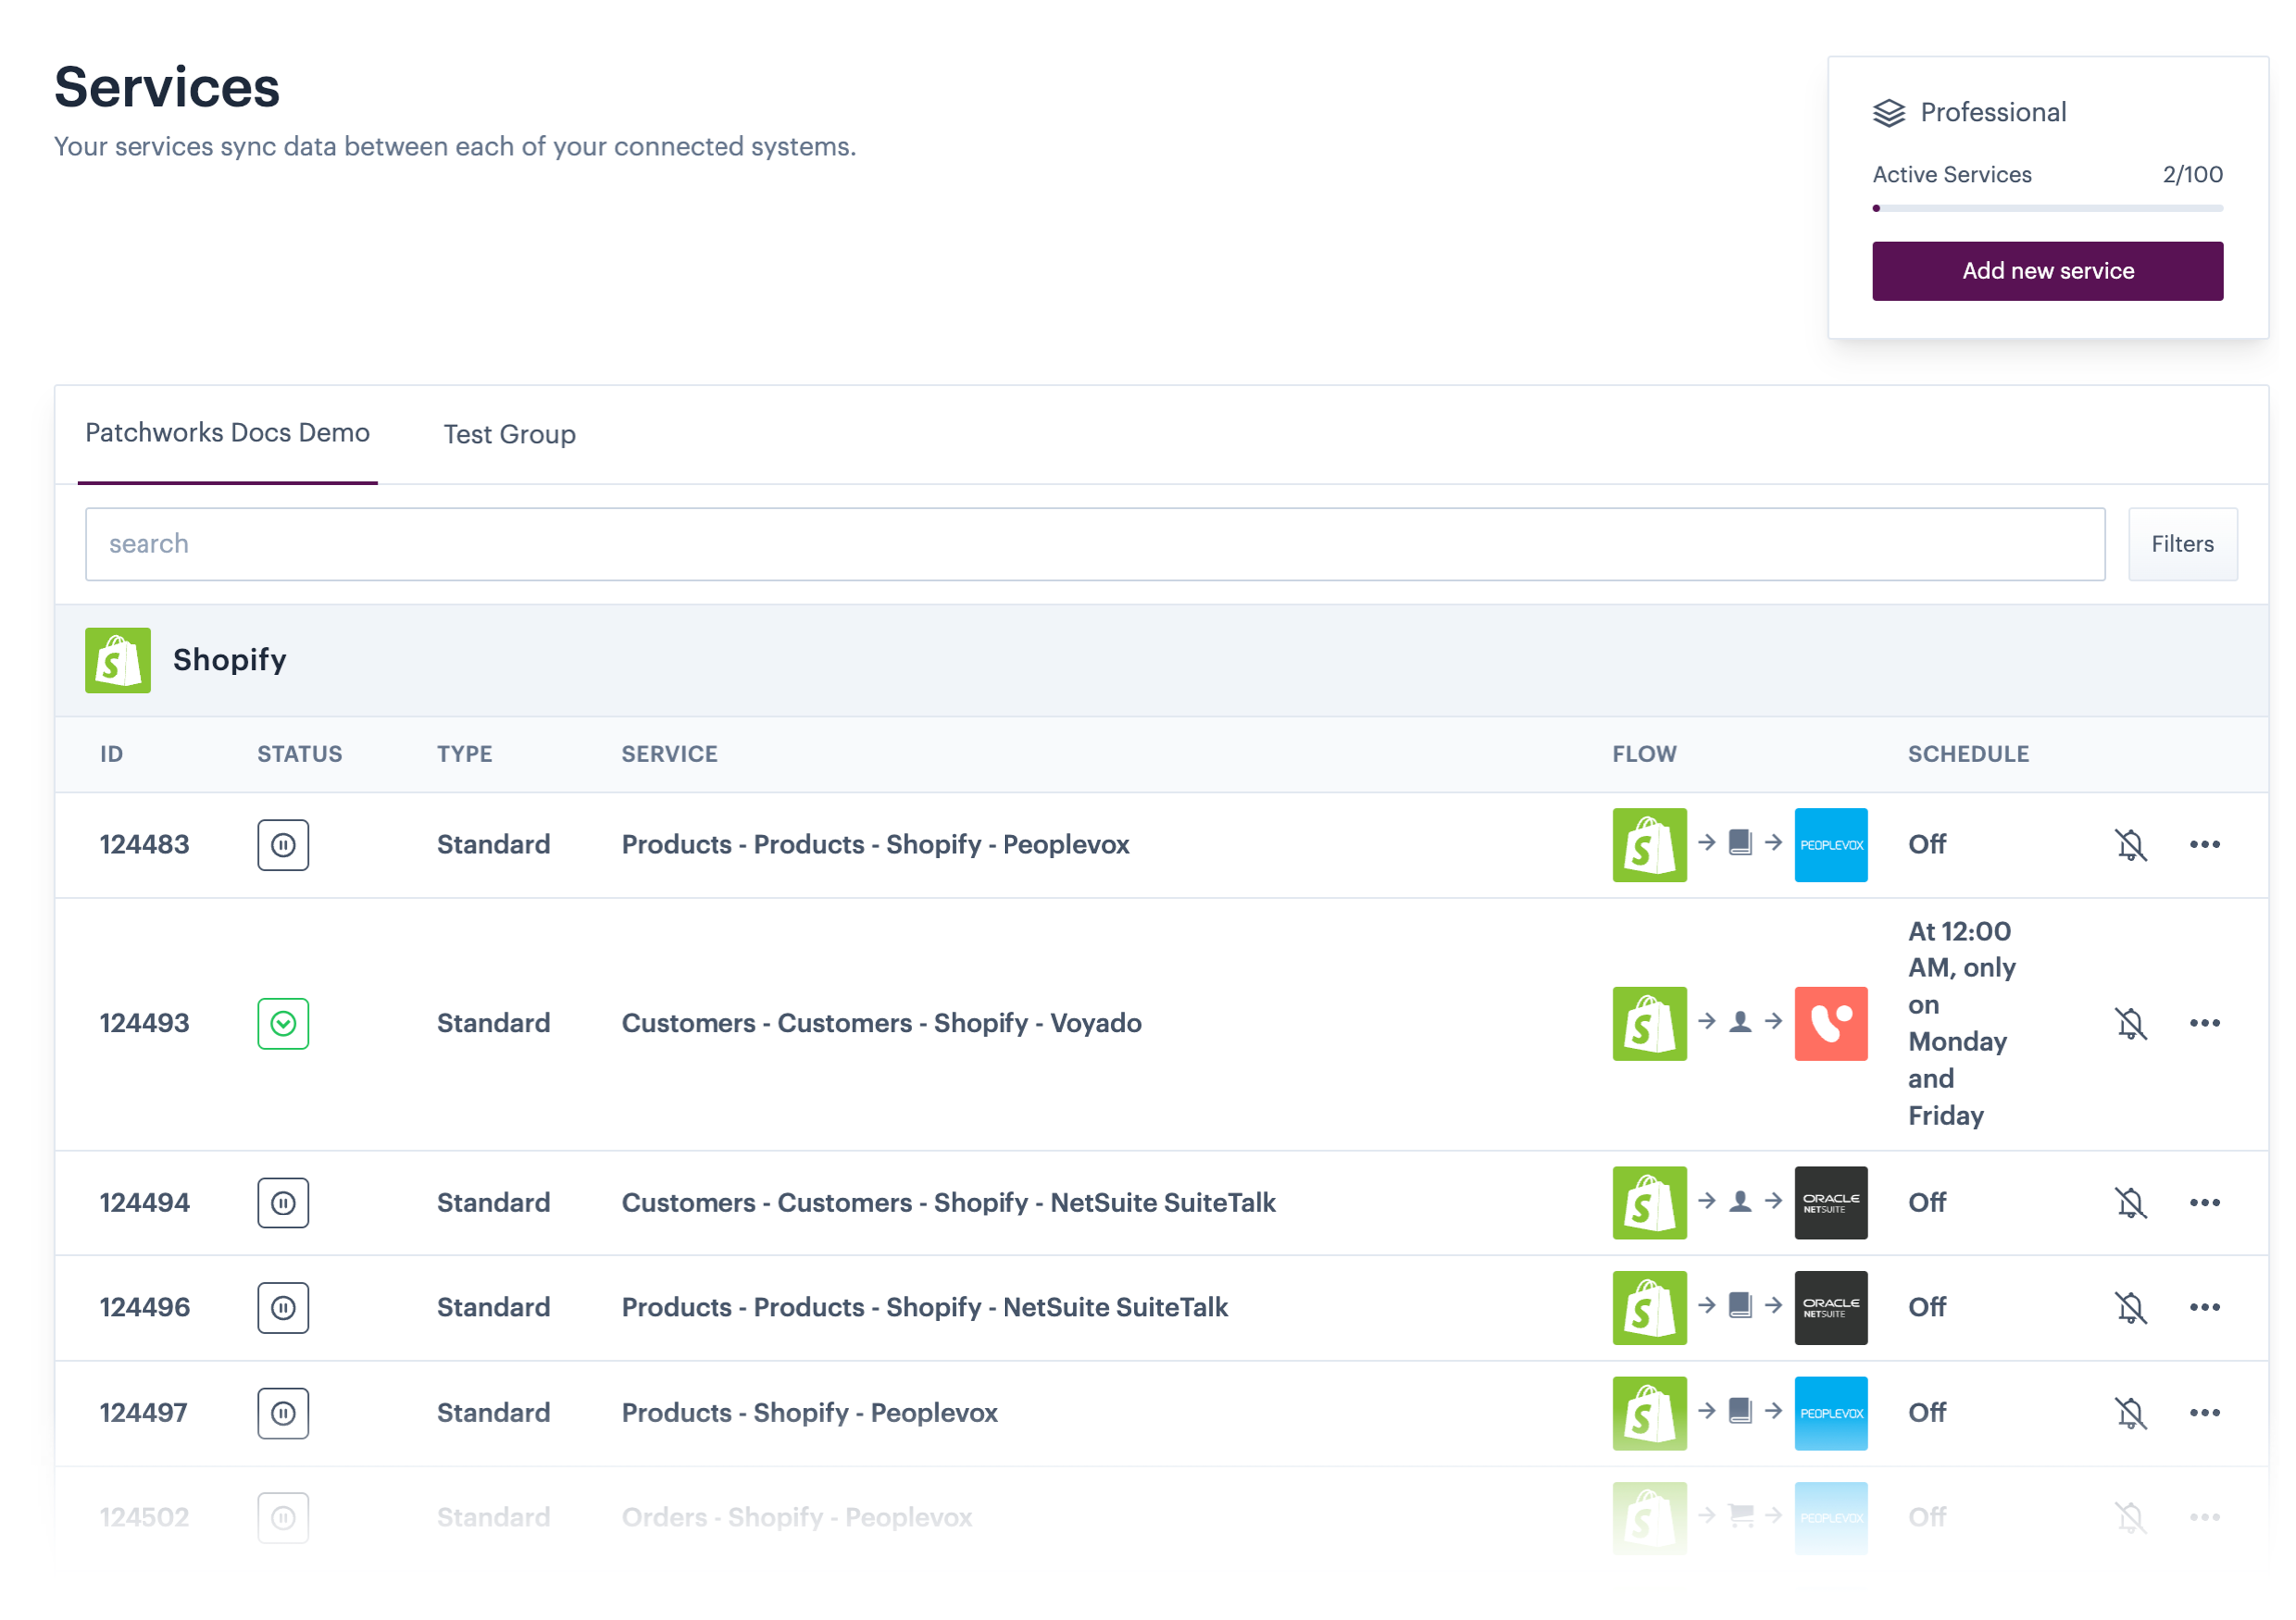
Please see accessing services if you're unsure how to get to this point.
Step 2
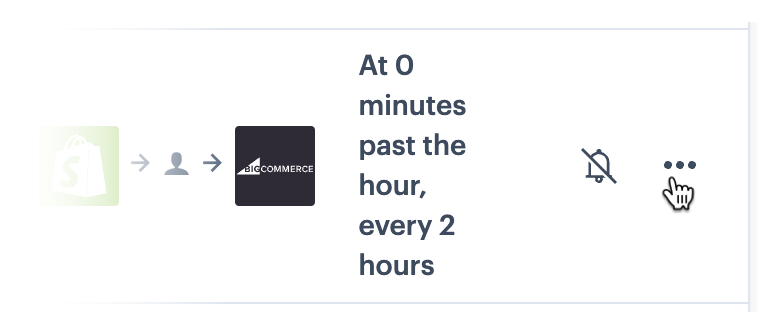
Locate the required service and click the options ellipsis:
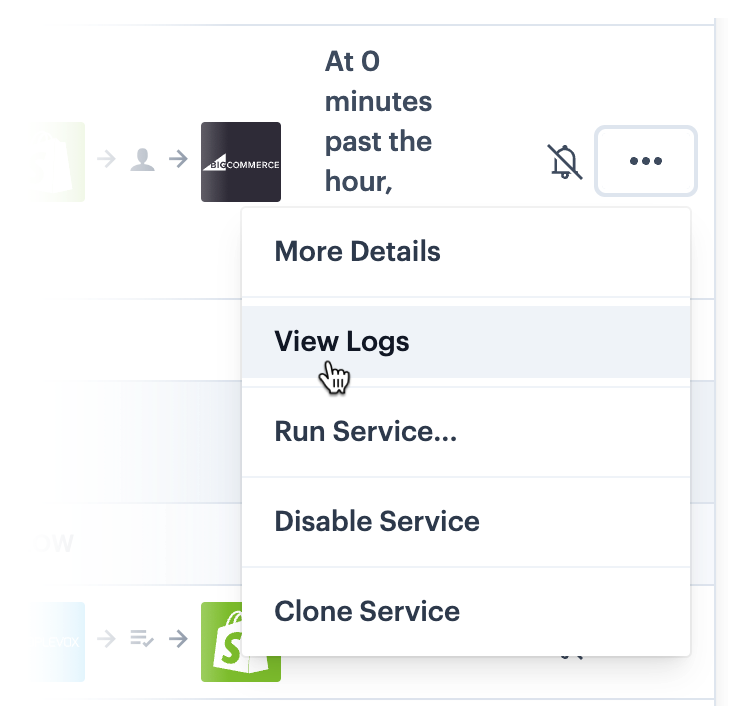
Step 3 Select view logs from the dropdown menu:
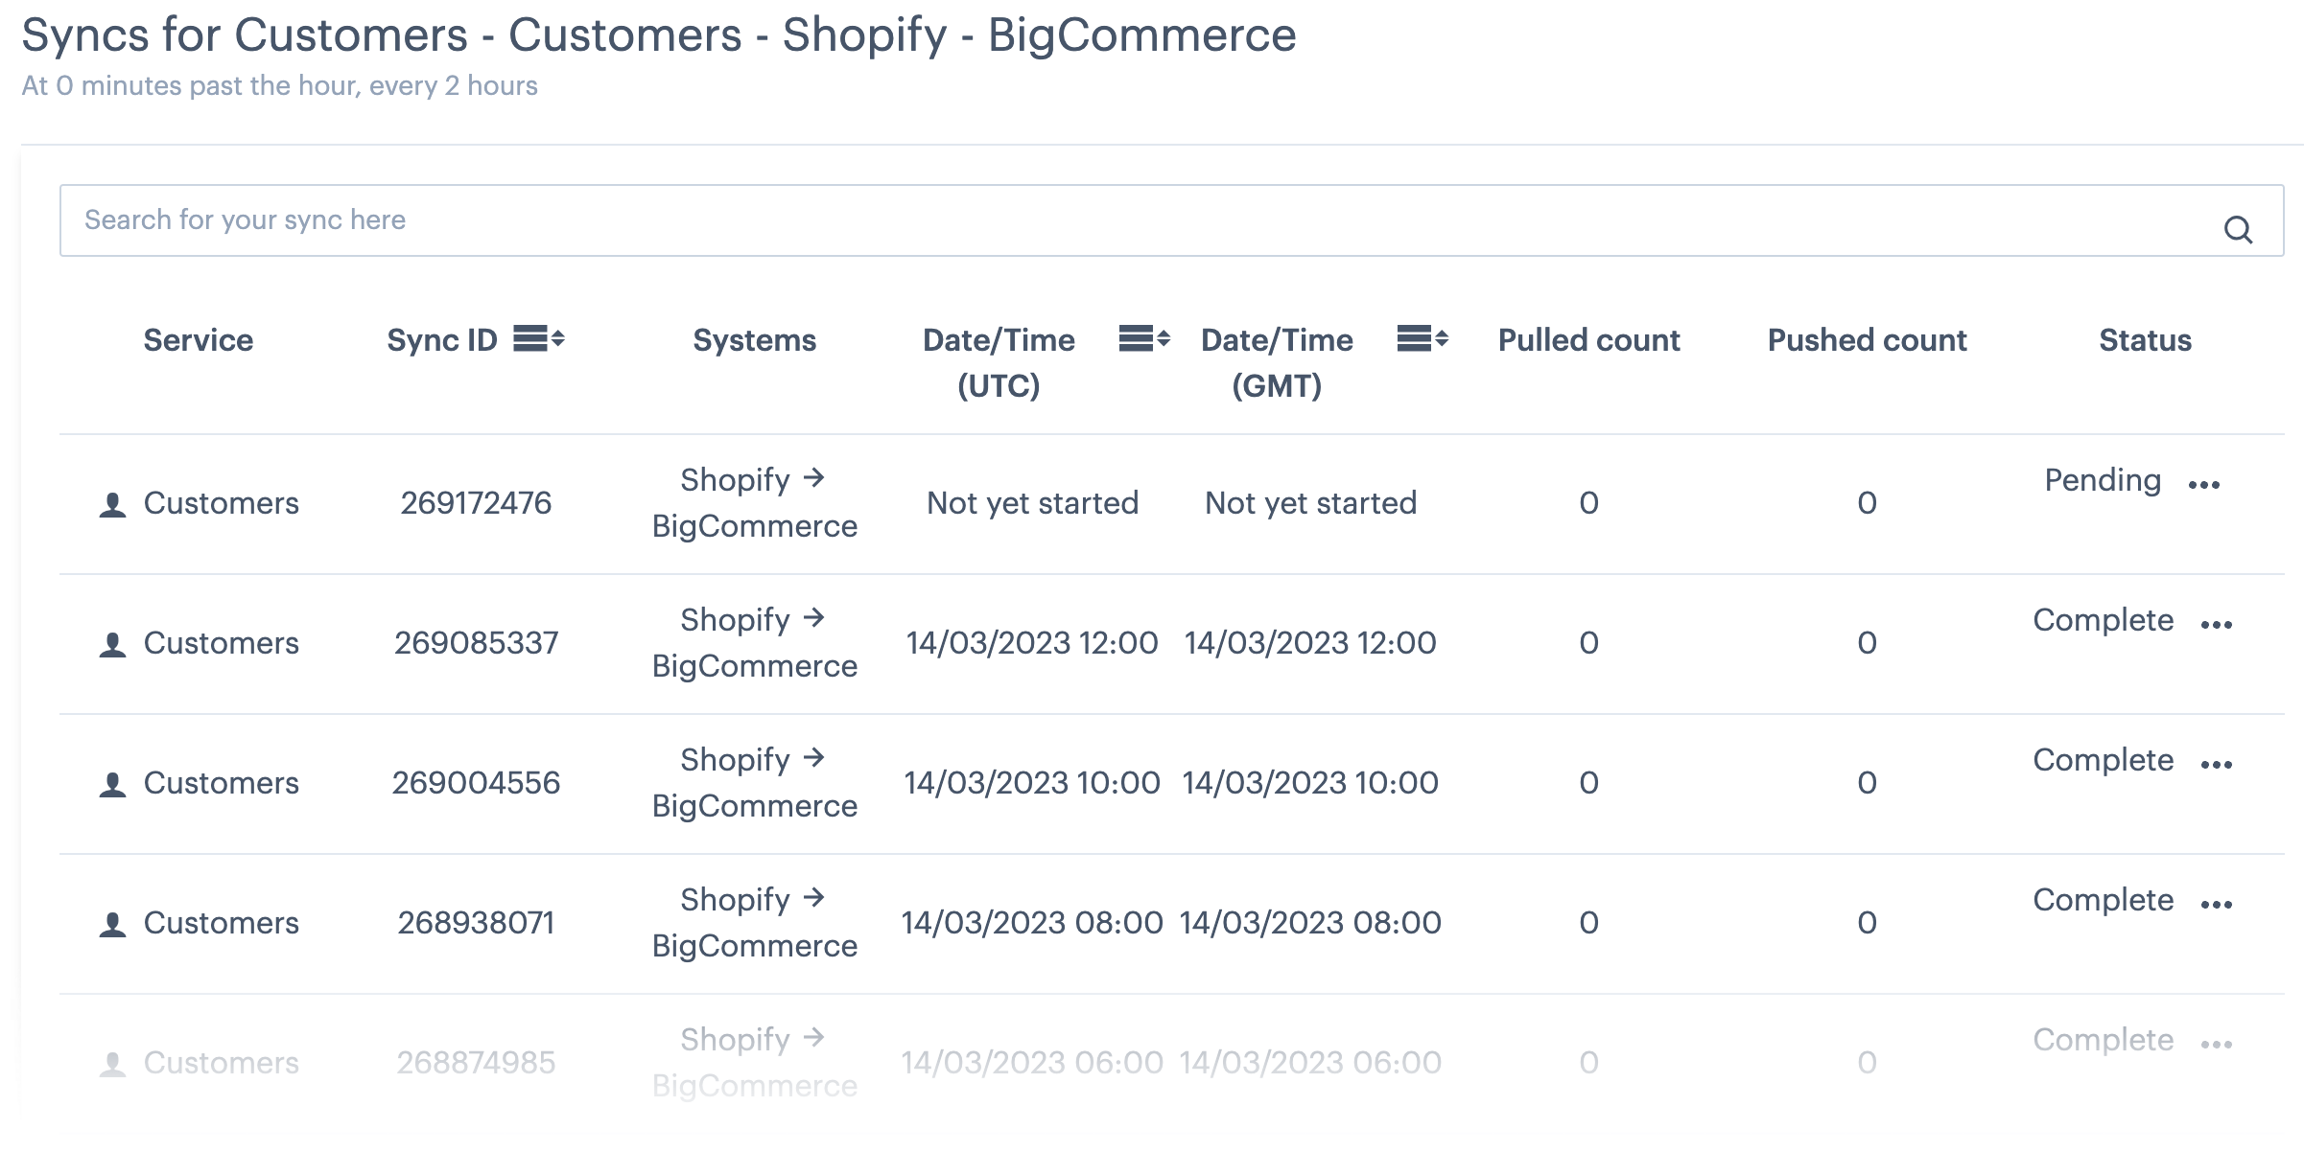
...the service summary is displayed, showing a list of all syncs - for example:
What's the difference between pulled and pushed counts?
When viewing detailed logs for a service, you will now see pulled count and pushed count columns - for example:

The pulled count is the number of records retrieved from the source for processing and the pushed count is the number of records synced to the destination.
These numbers may vary for a number of reasons. For example, if a service is run manually with filters to pull all records from the last hour but a scheduled sync completed ten minutes previously, the manual sync will contain records that have already been processed so they won't be processed again.
Accessing detailed logs for a sync
Detailed sync logs are available by navigating a bit further into the service. Here, you can view detailed information for each sync - if a sync is in progress, the associated log refreshes every five seconds, giving you a live view of what's happening. To view this information, follow the steps below:
Step 1 Follow the steps above to access sync summary information for the required service.
Step 2 Select more details from the ellipses menu associated with the sync you wish to view:
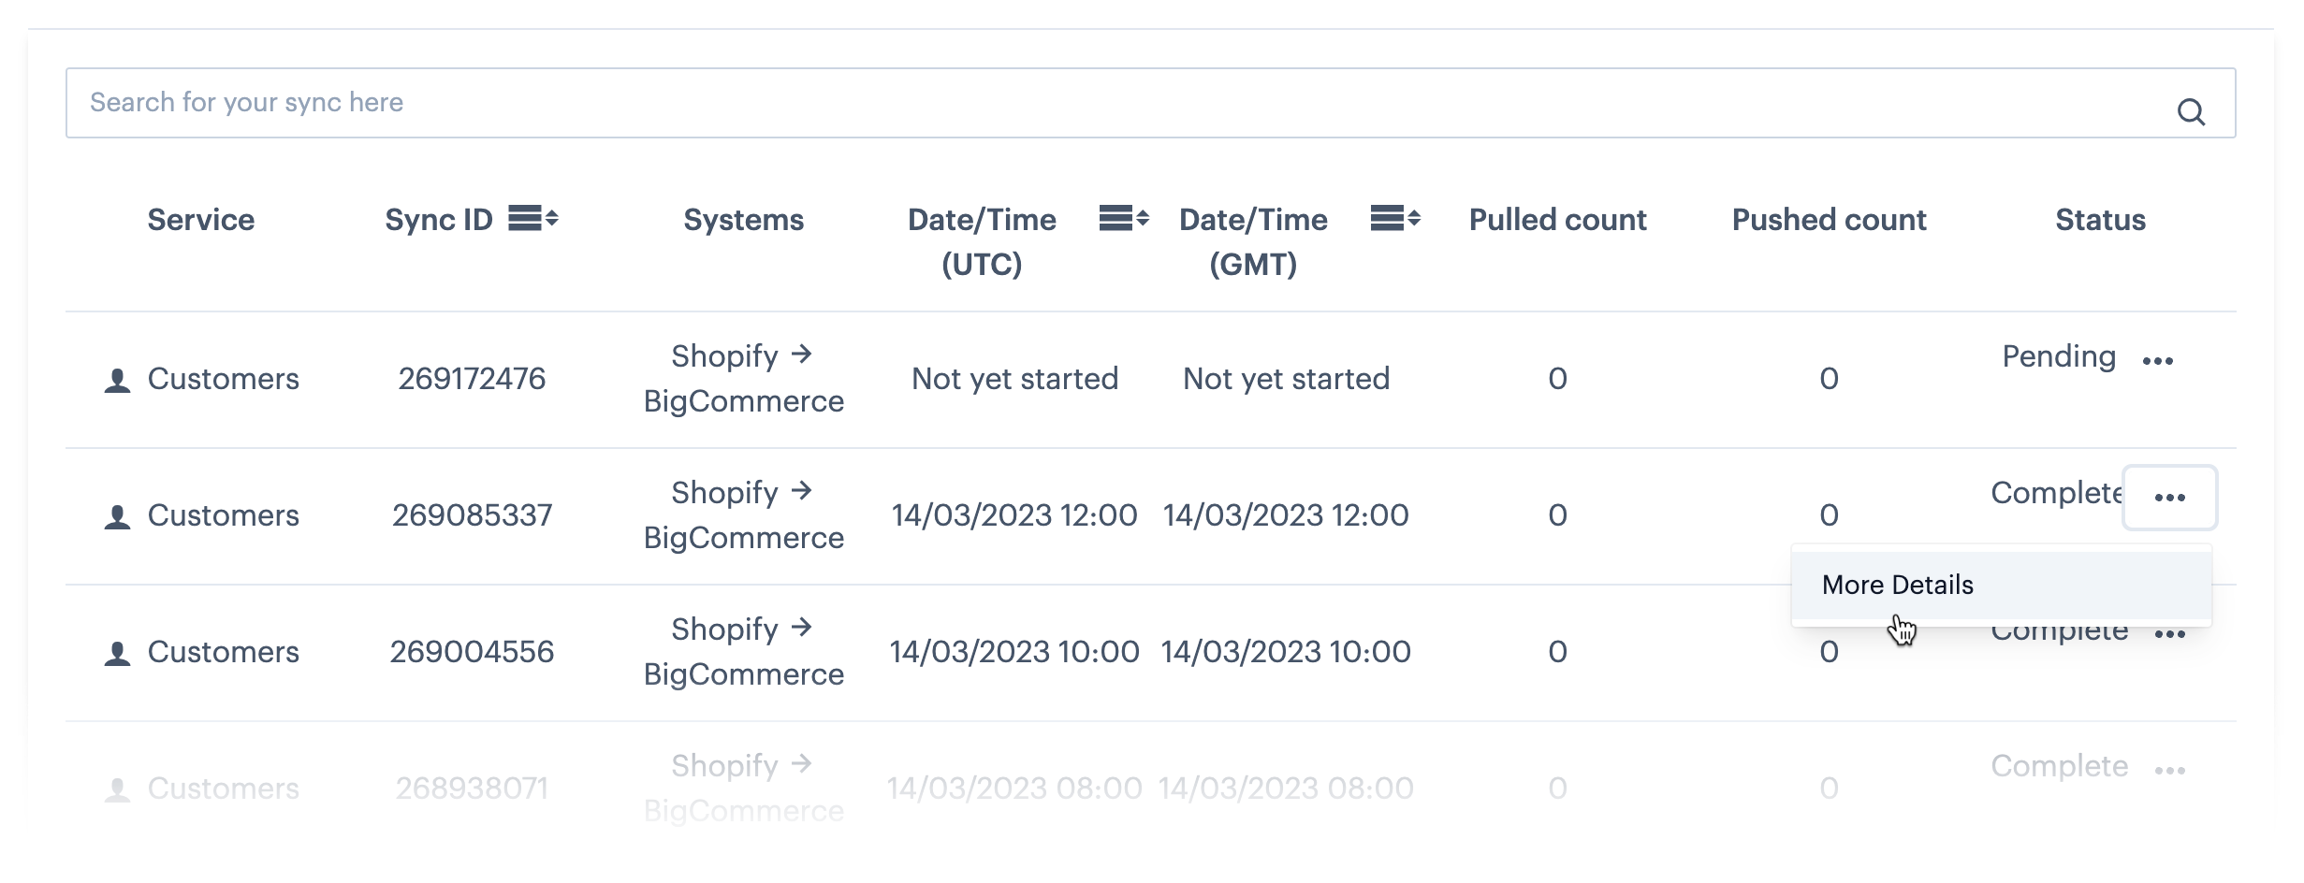
...logs for this sync are displayed:
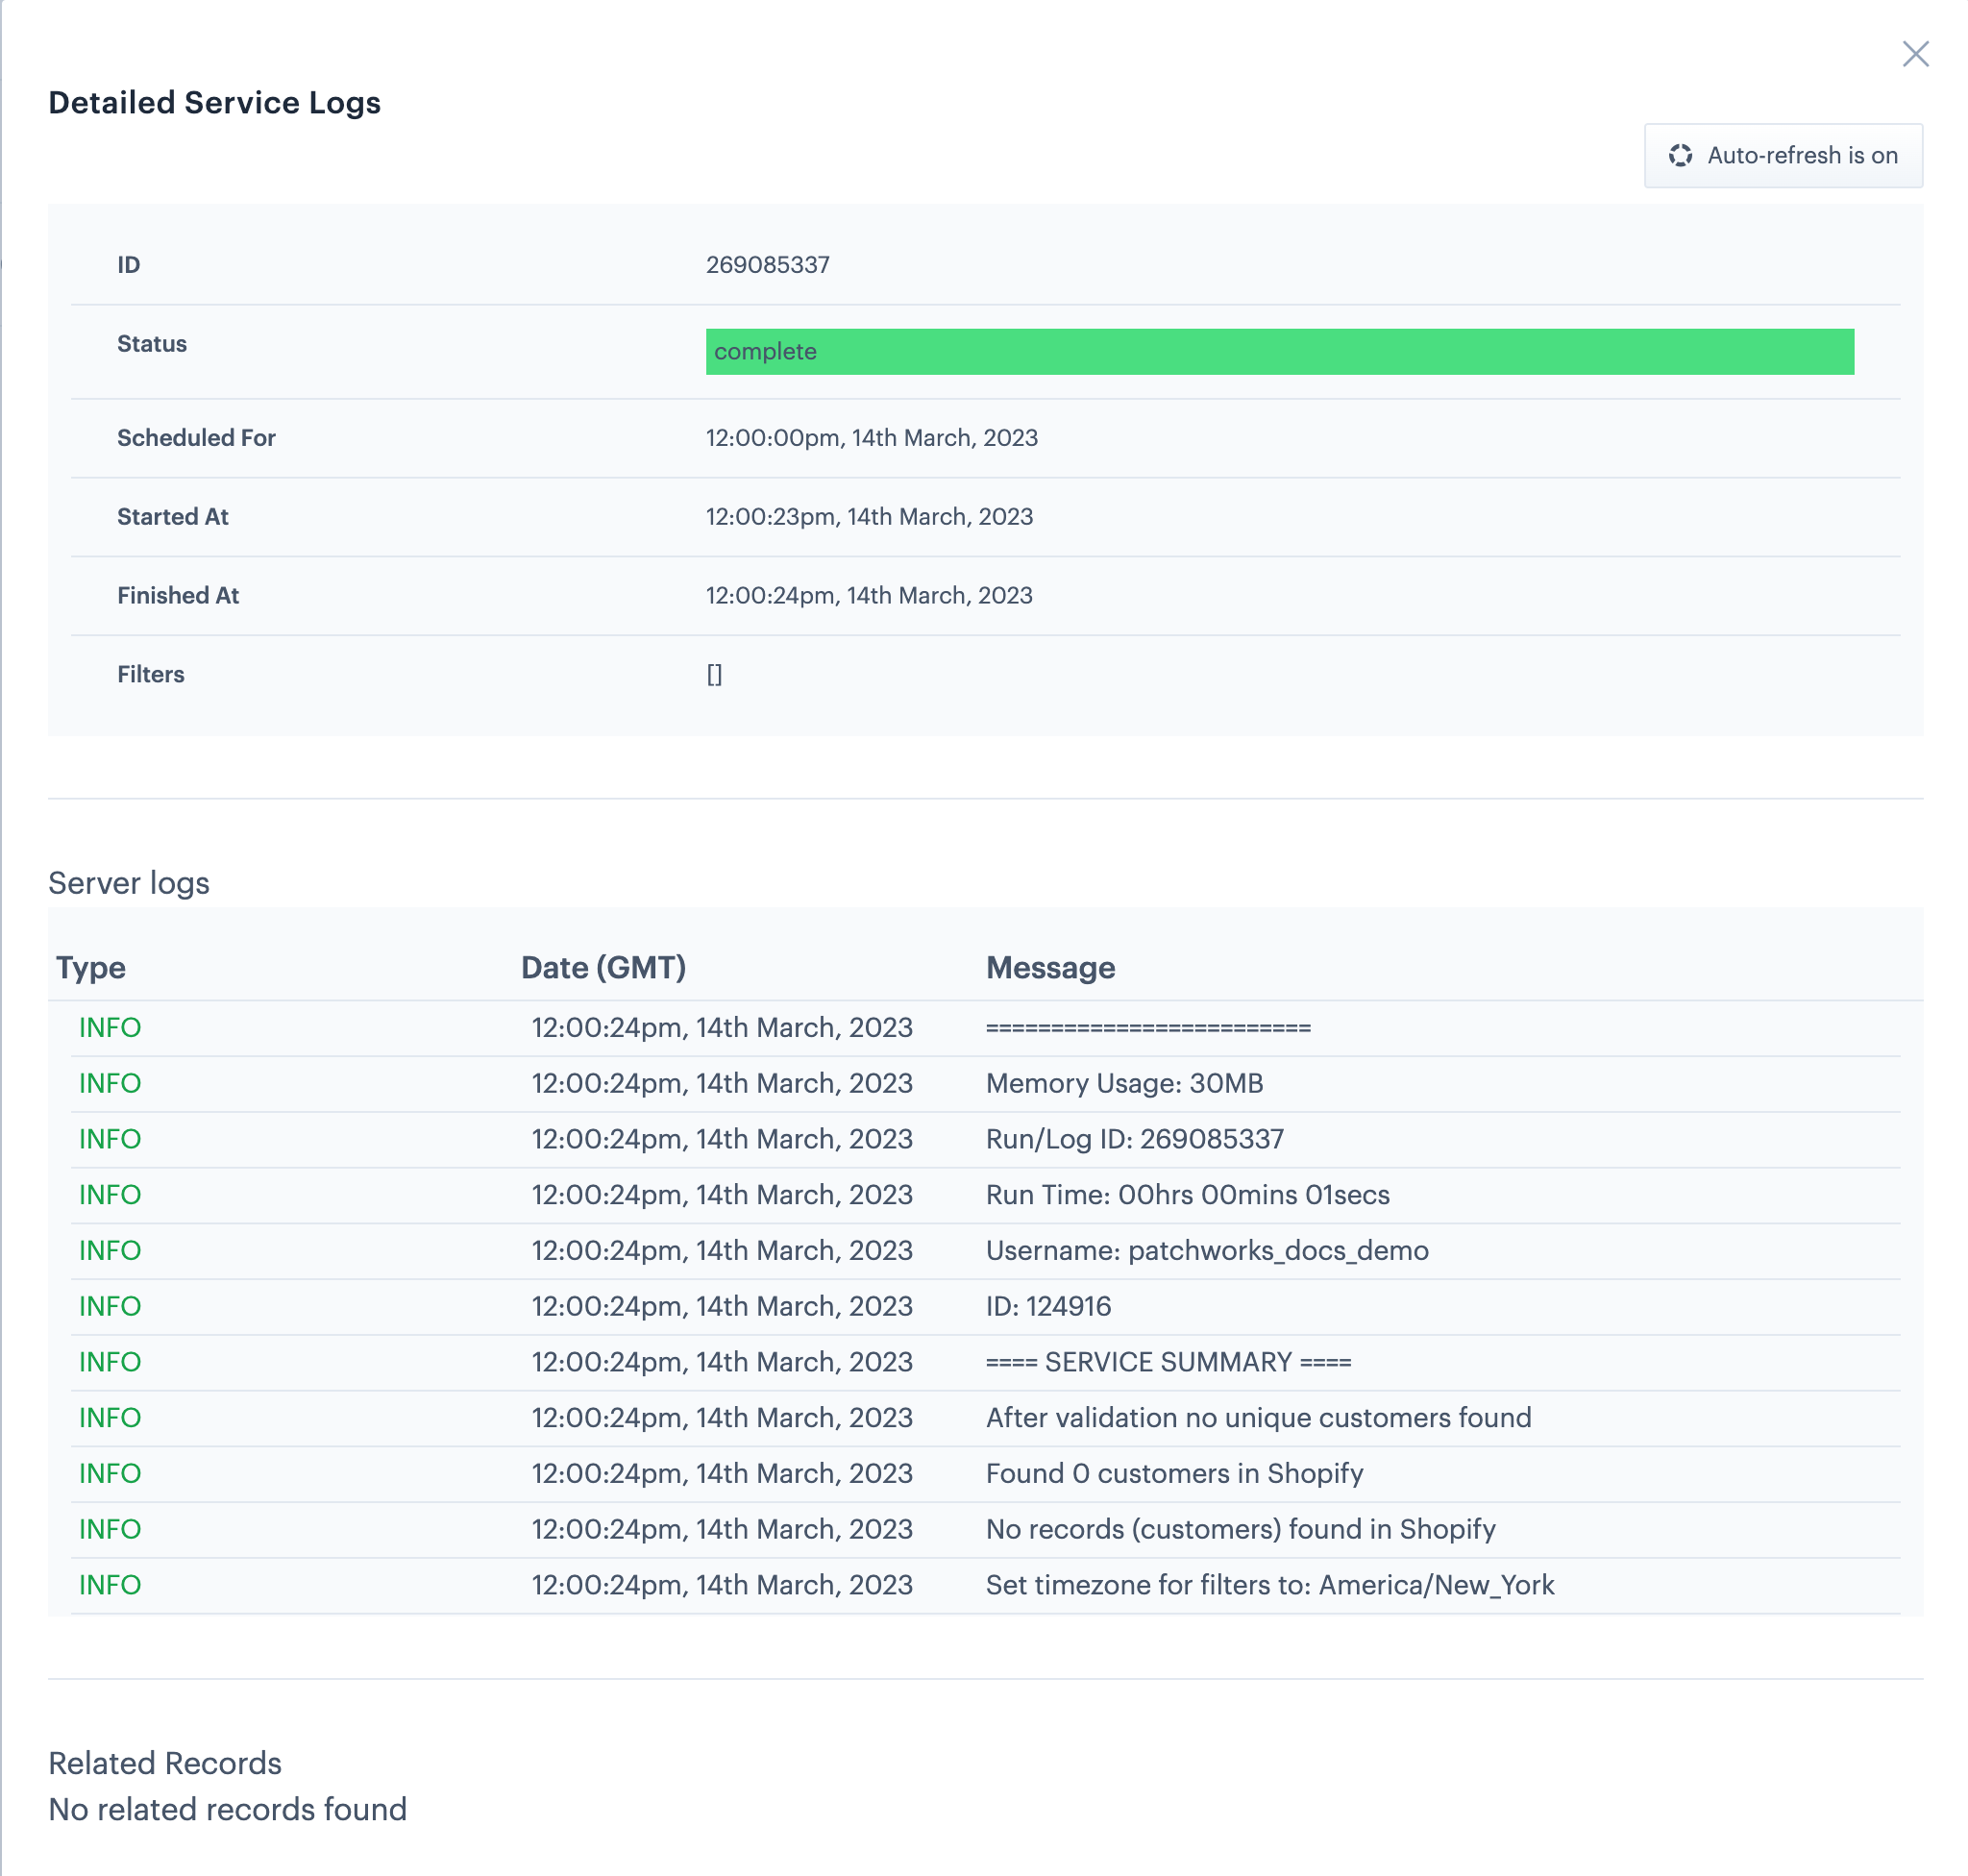
Here, you'll see a line-by-line log for the sync. If you're viewing this log while a sync is running, it auto-refreshes every five seconds, so you have a live view. If required, you can pause the auto-refresh by clicking the auto-refresh is on button (so it toggles to 'off'):

Payload files
When a service is run manually, options are available to store pull, push and custom script payload files:
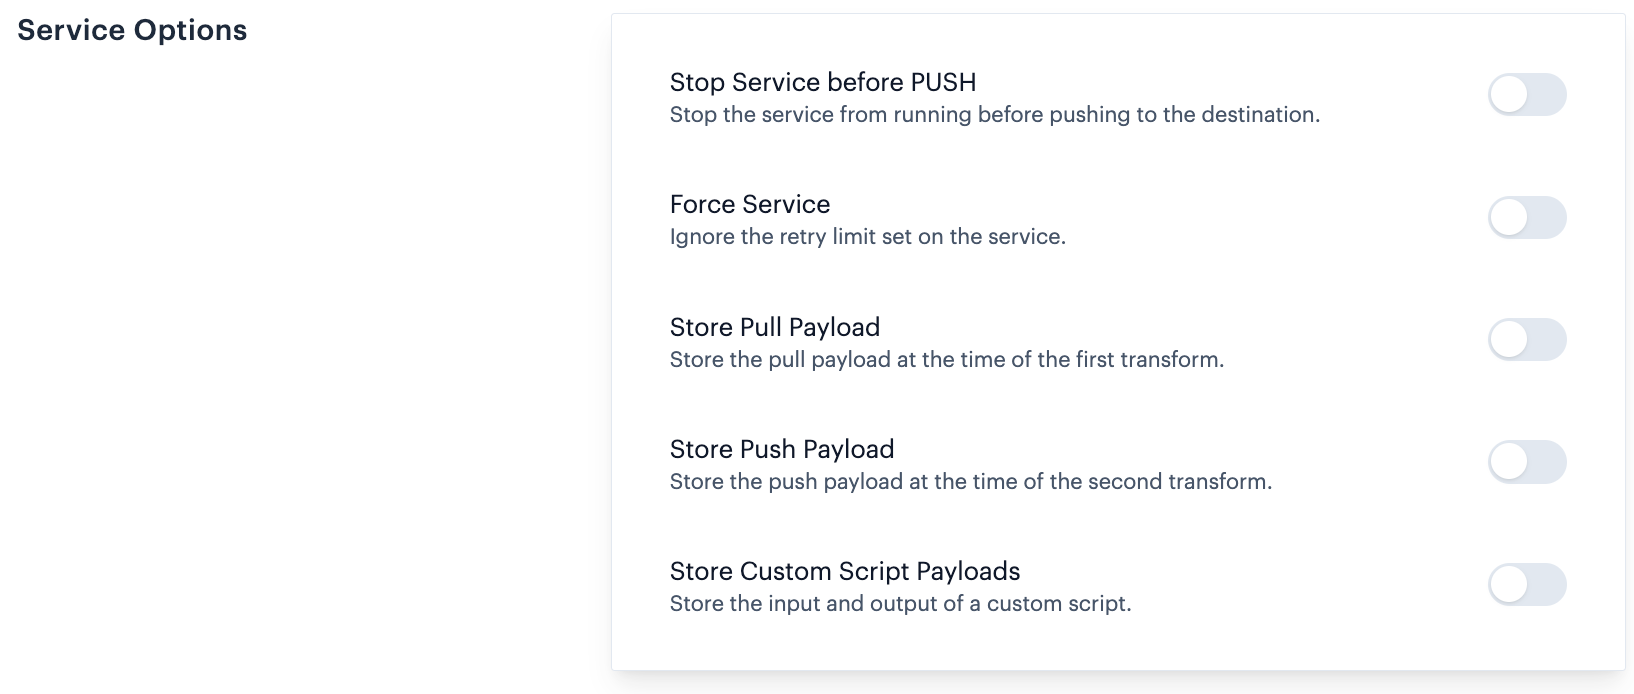
If any of these options are toggled 'on', links to the associated files will be available at the relevant point in the service log for a period of 24 hours after the service completed. For example:
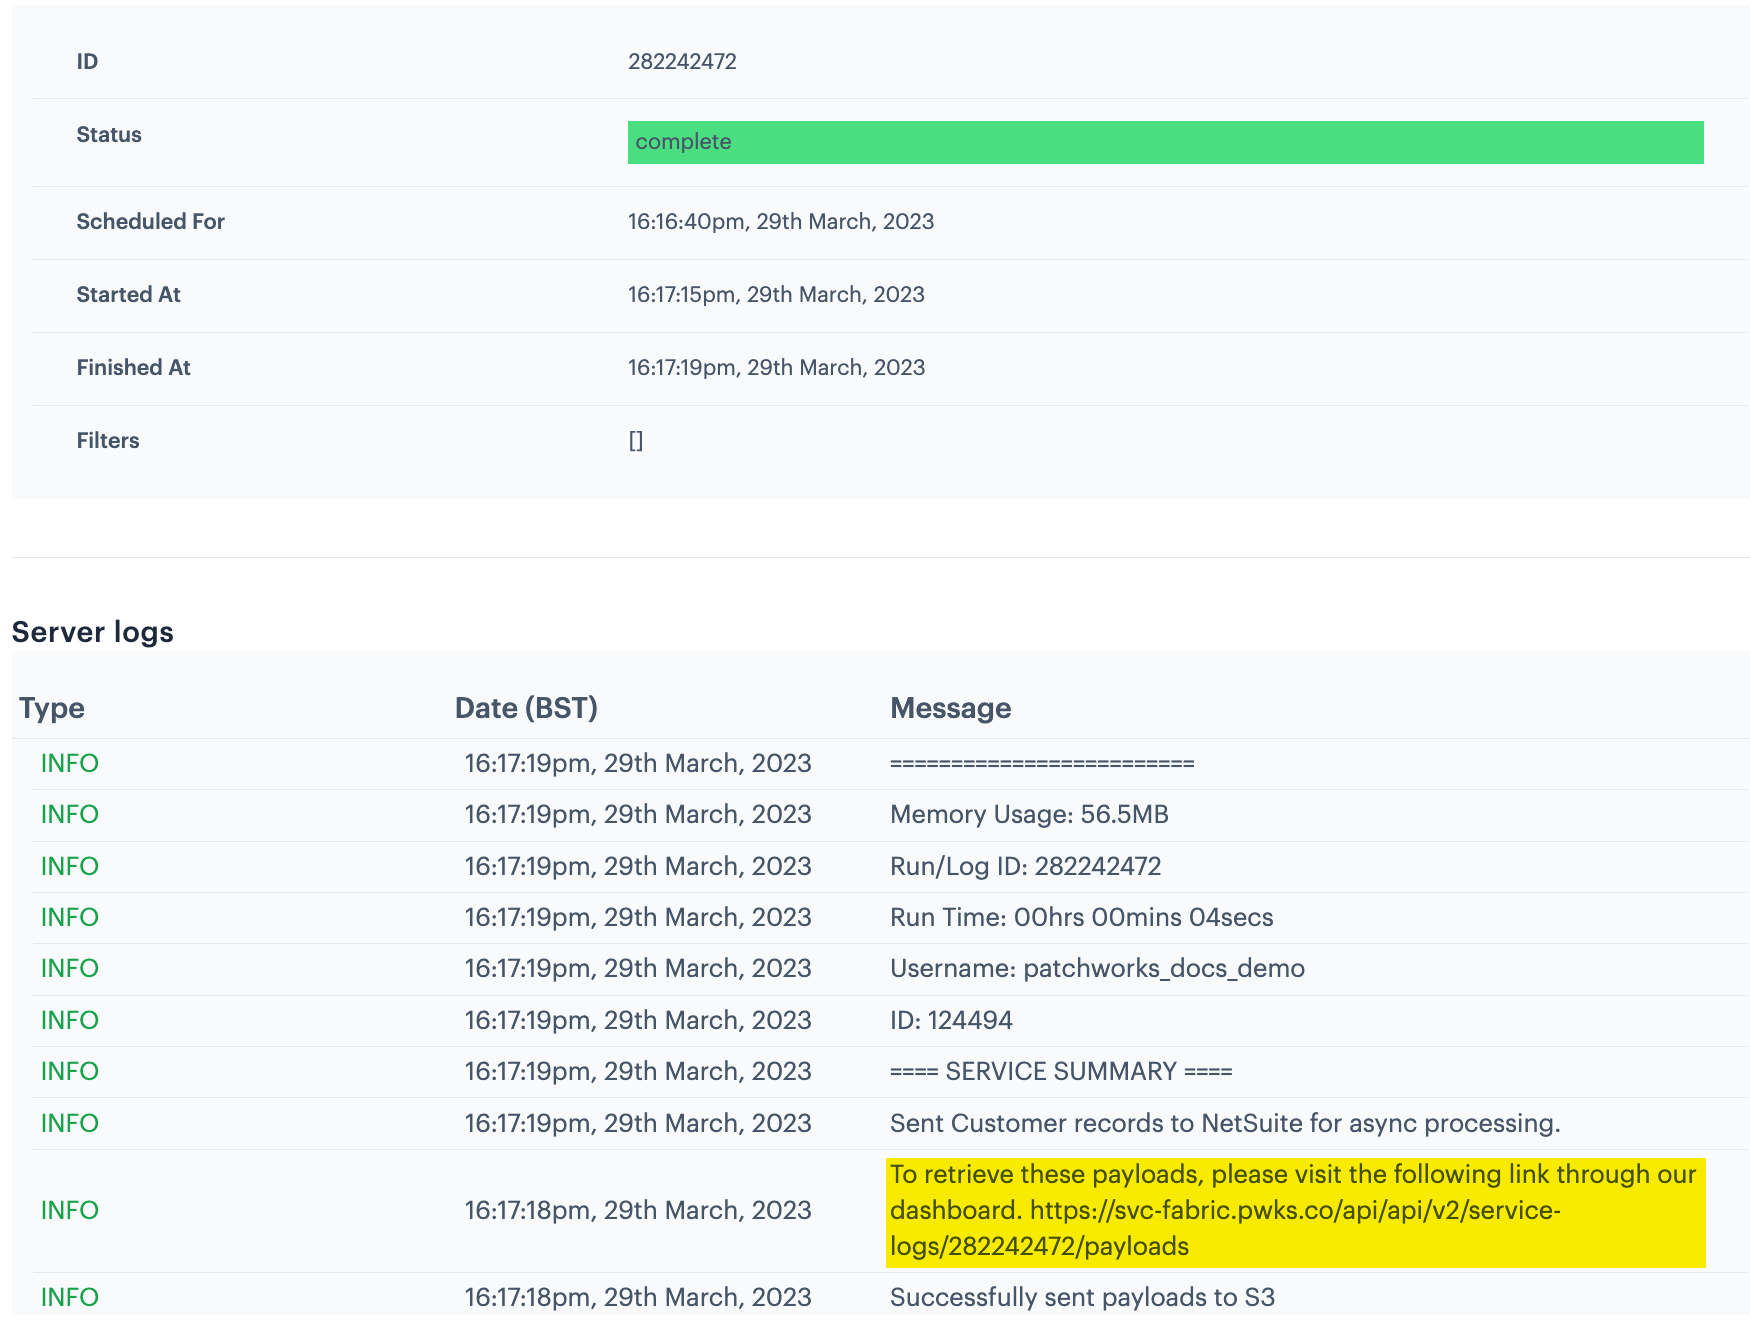
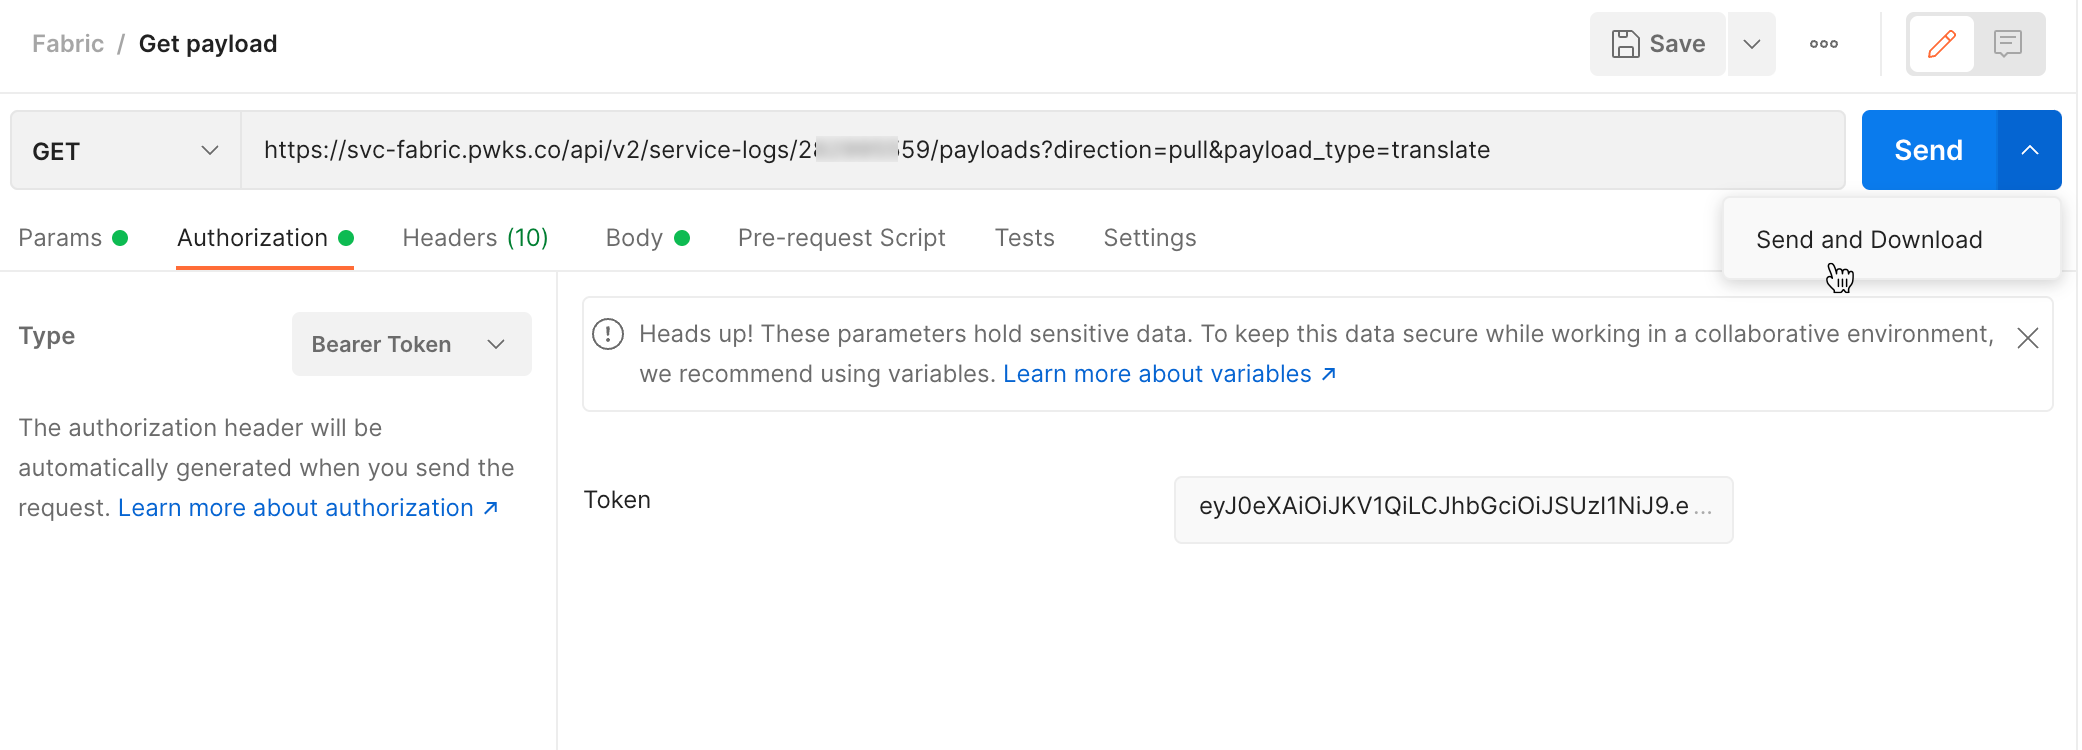
To access these files, you'll need to send a GET request, authenticated with a Patchworks token. For example:
