Service summary
Introduction
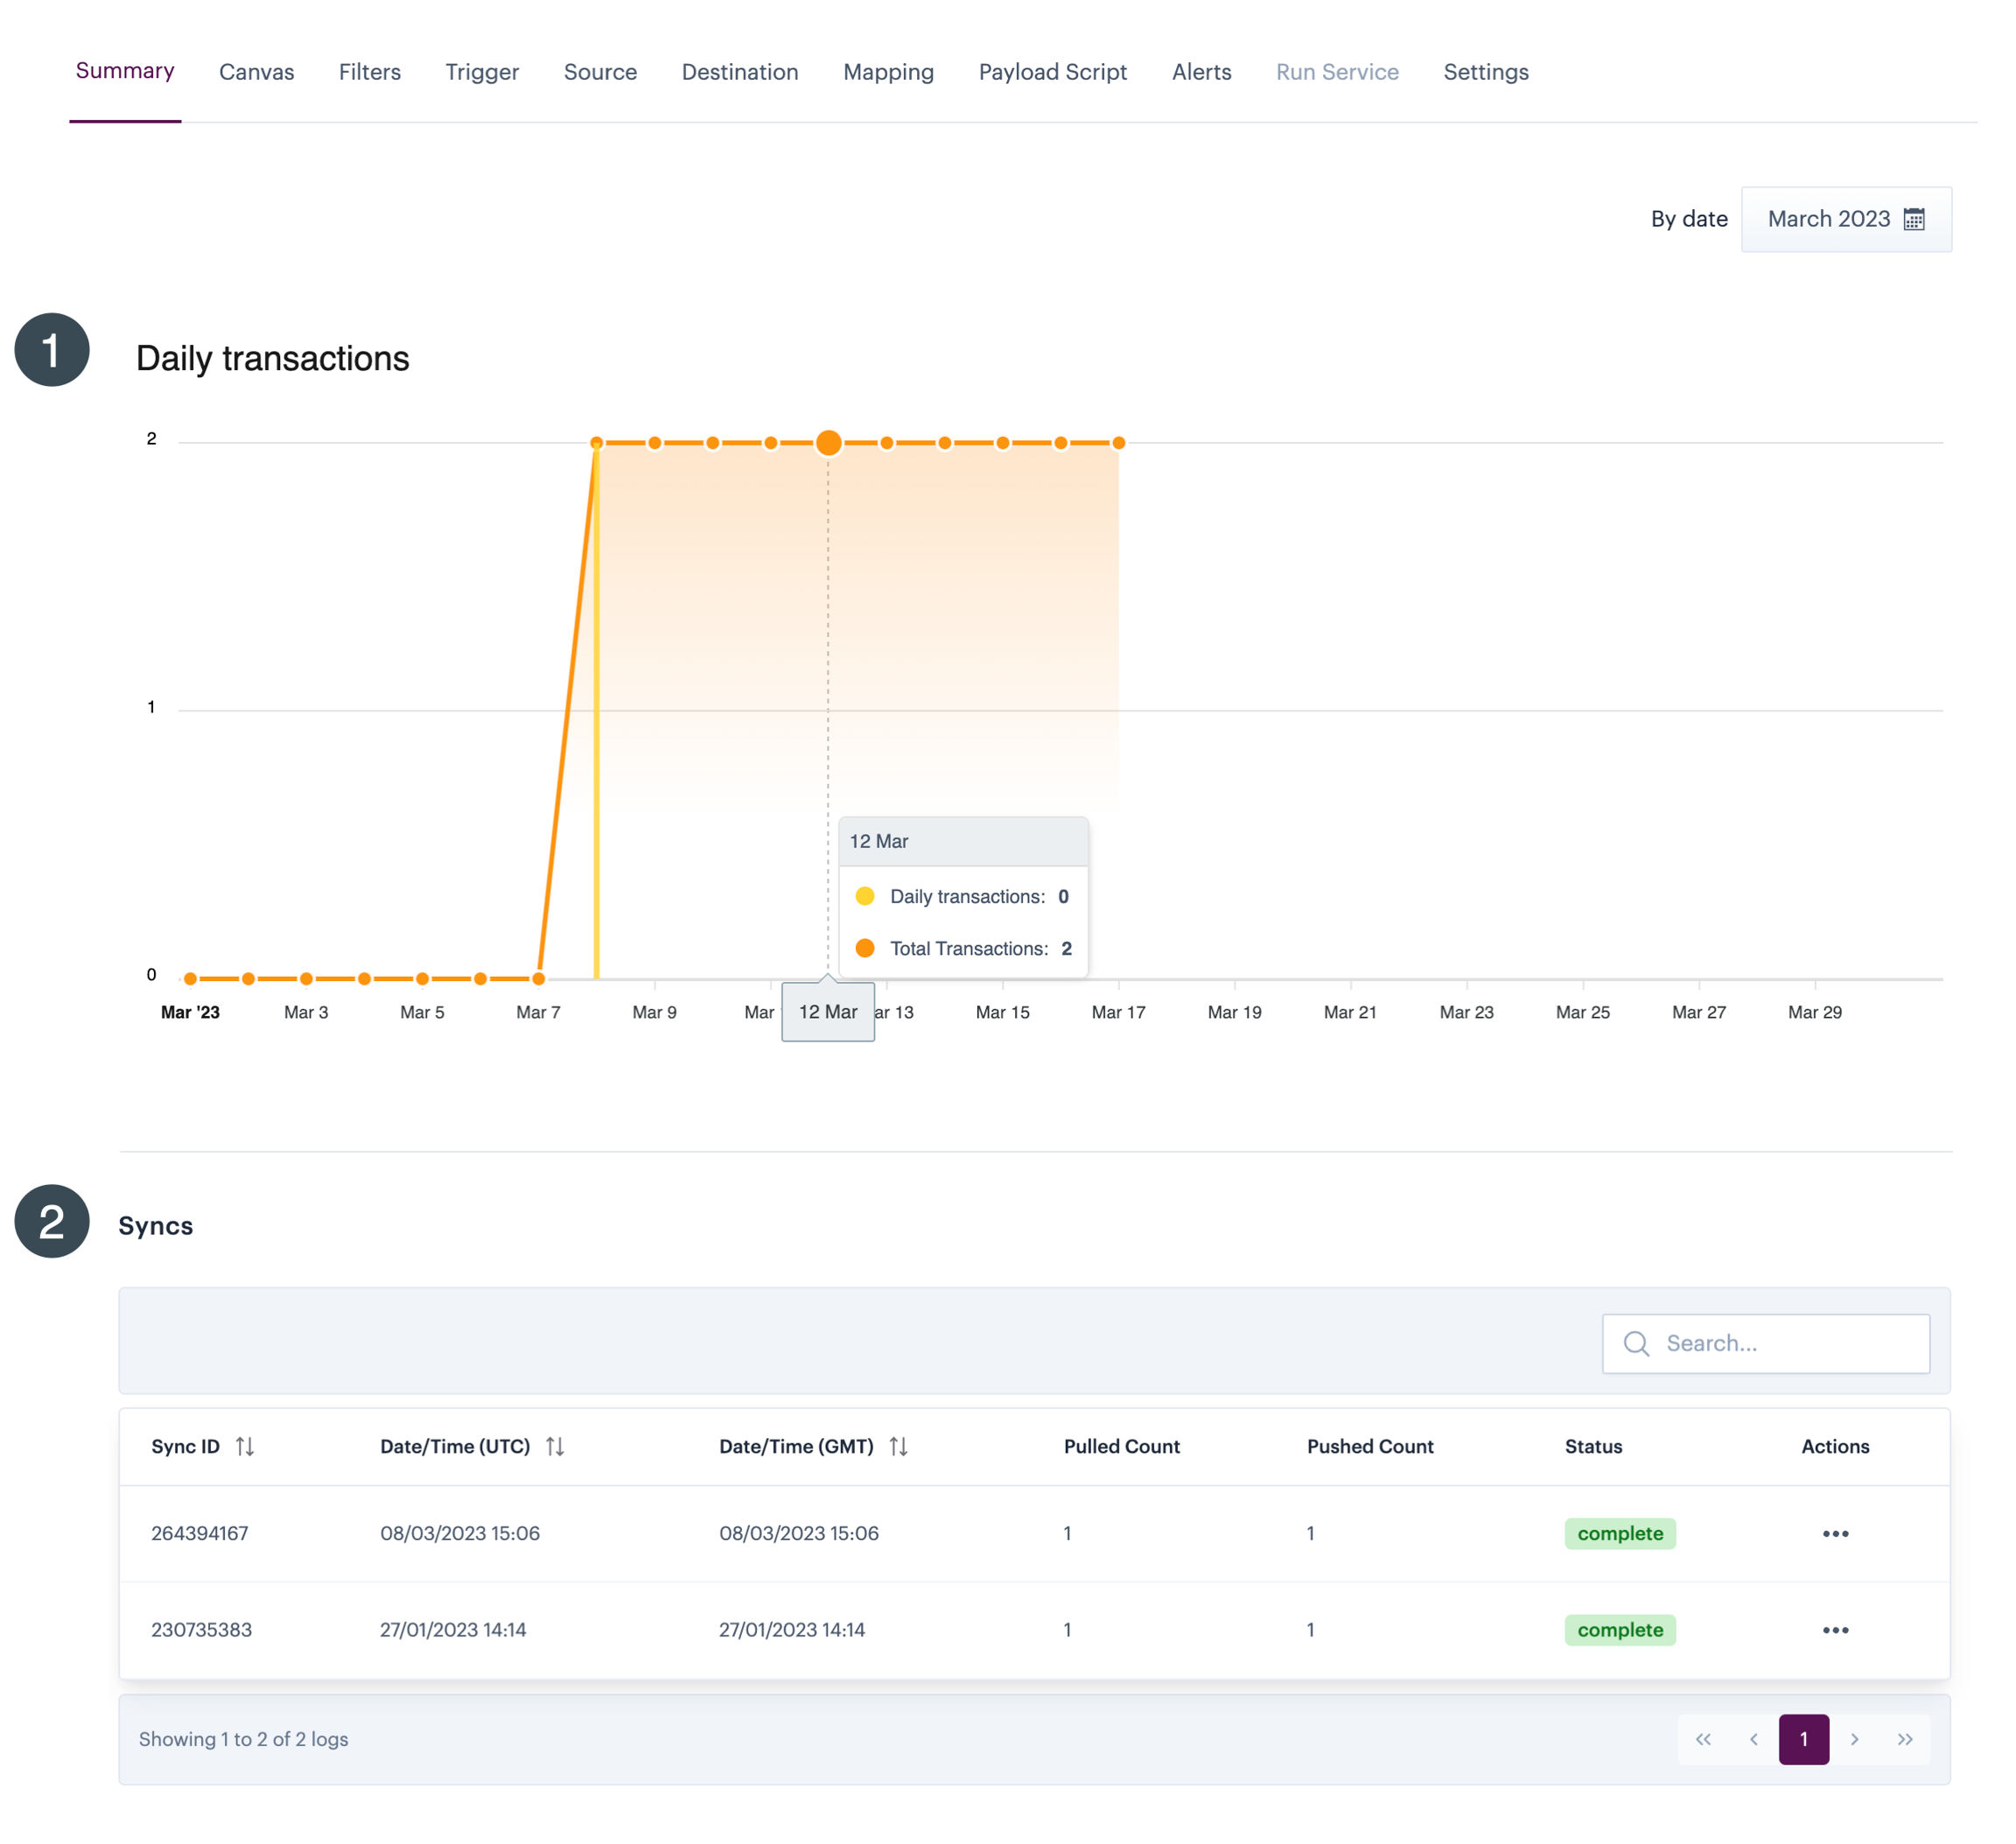
The summary tab shows high-level information about how the service is performing. The tab is split into two panes - daily transactions (see 1 below), followed by a sync list (see 2 below).
Daily transactions
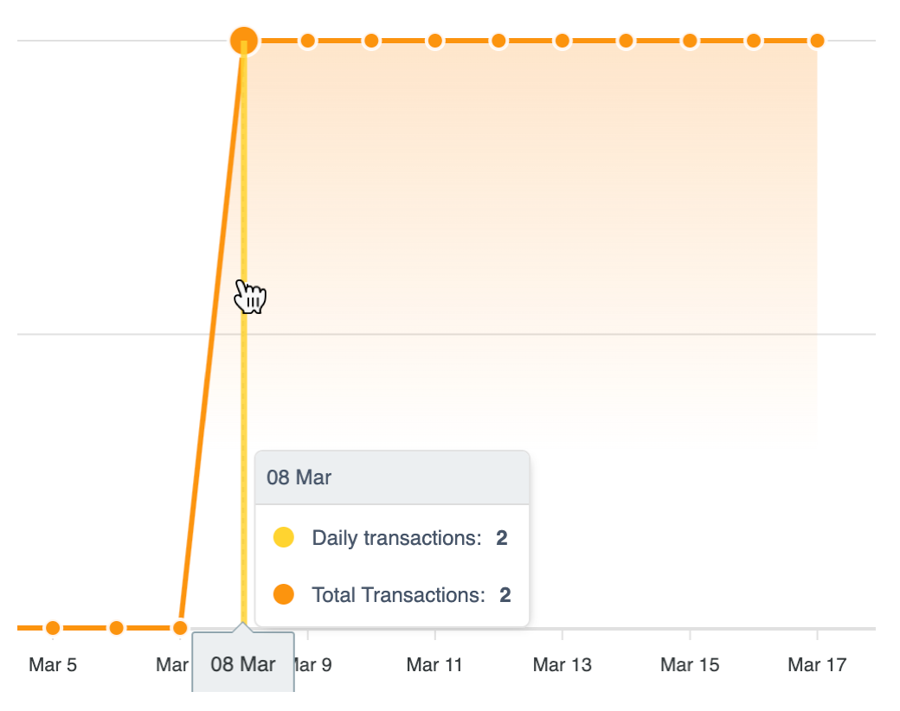
The daily transactions pane displays a chart showing transactions for the defined time period. Hover your cursor over any point on the chart for details - for example:
What is a transaction?
A transaction occurs whenever Patchworks pulls an entity (e.g. an order, refund, product or stock level) from a source system and subsequently pushes it to a destination system.
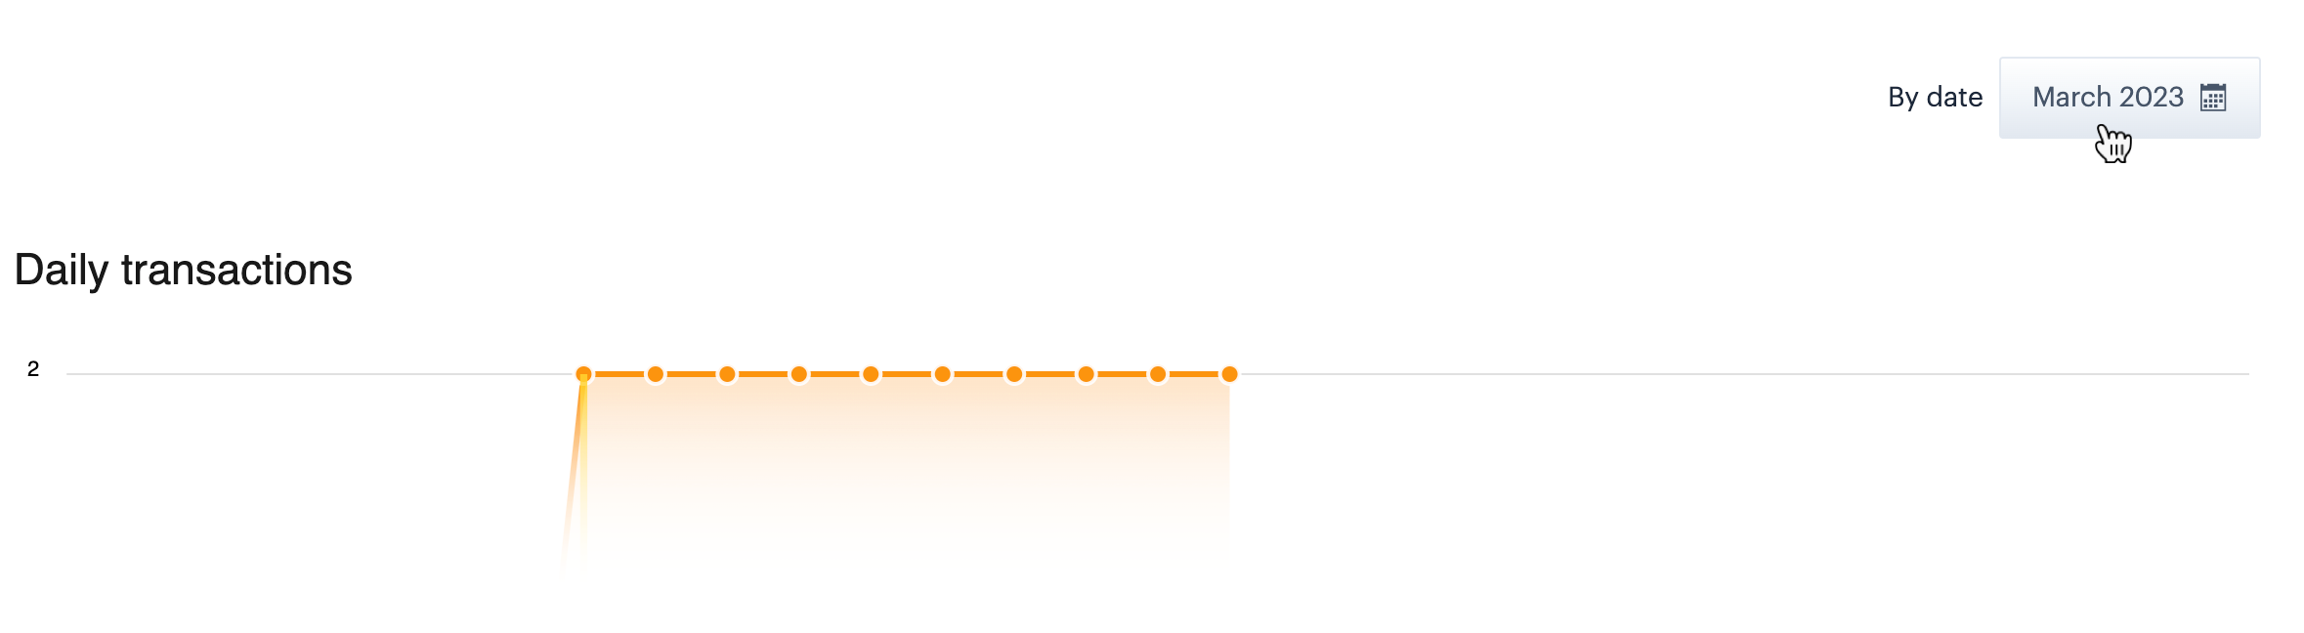
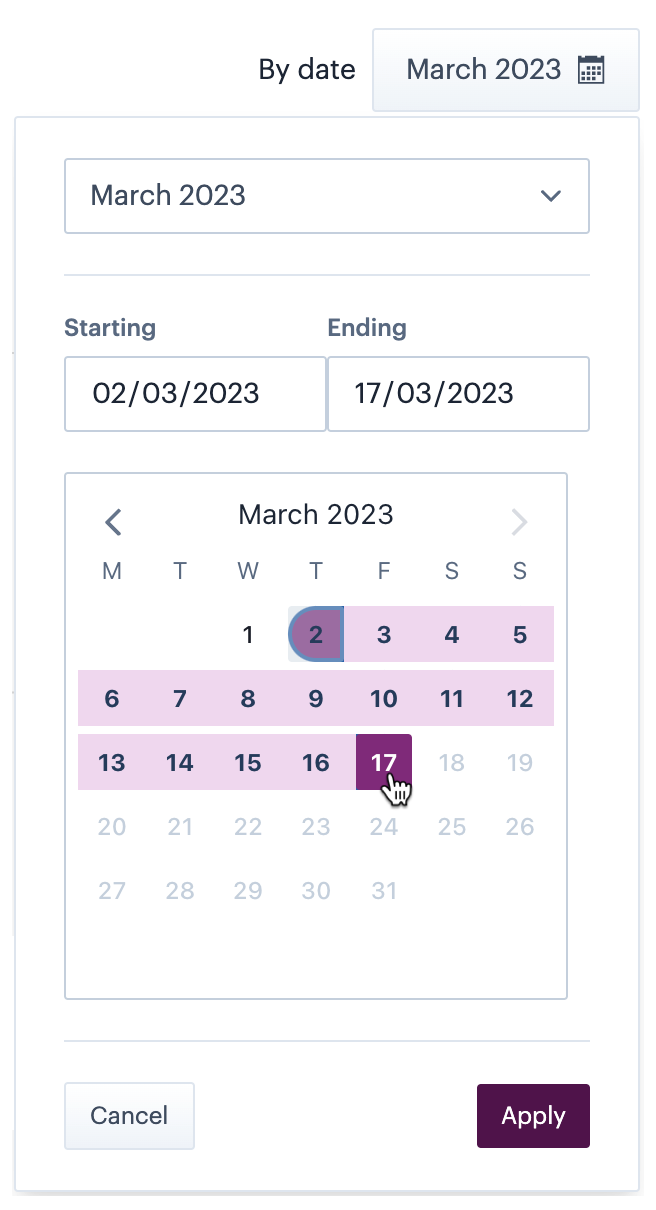
To set a time period for data shown on this chart, click the date picker:
Then click your starting date and move your cursor right/left to select the ending date - for example:
Sync list
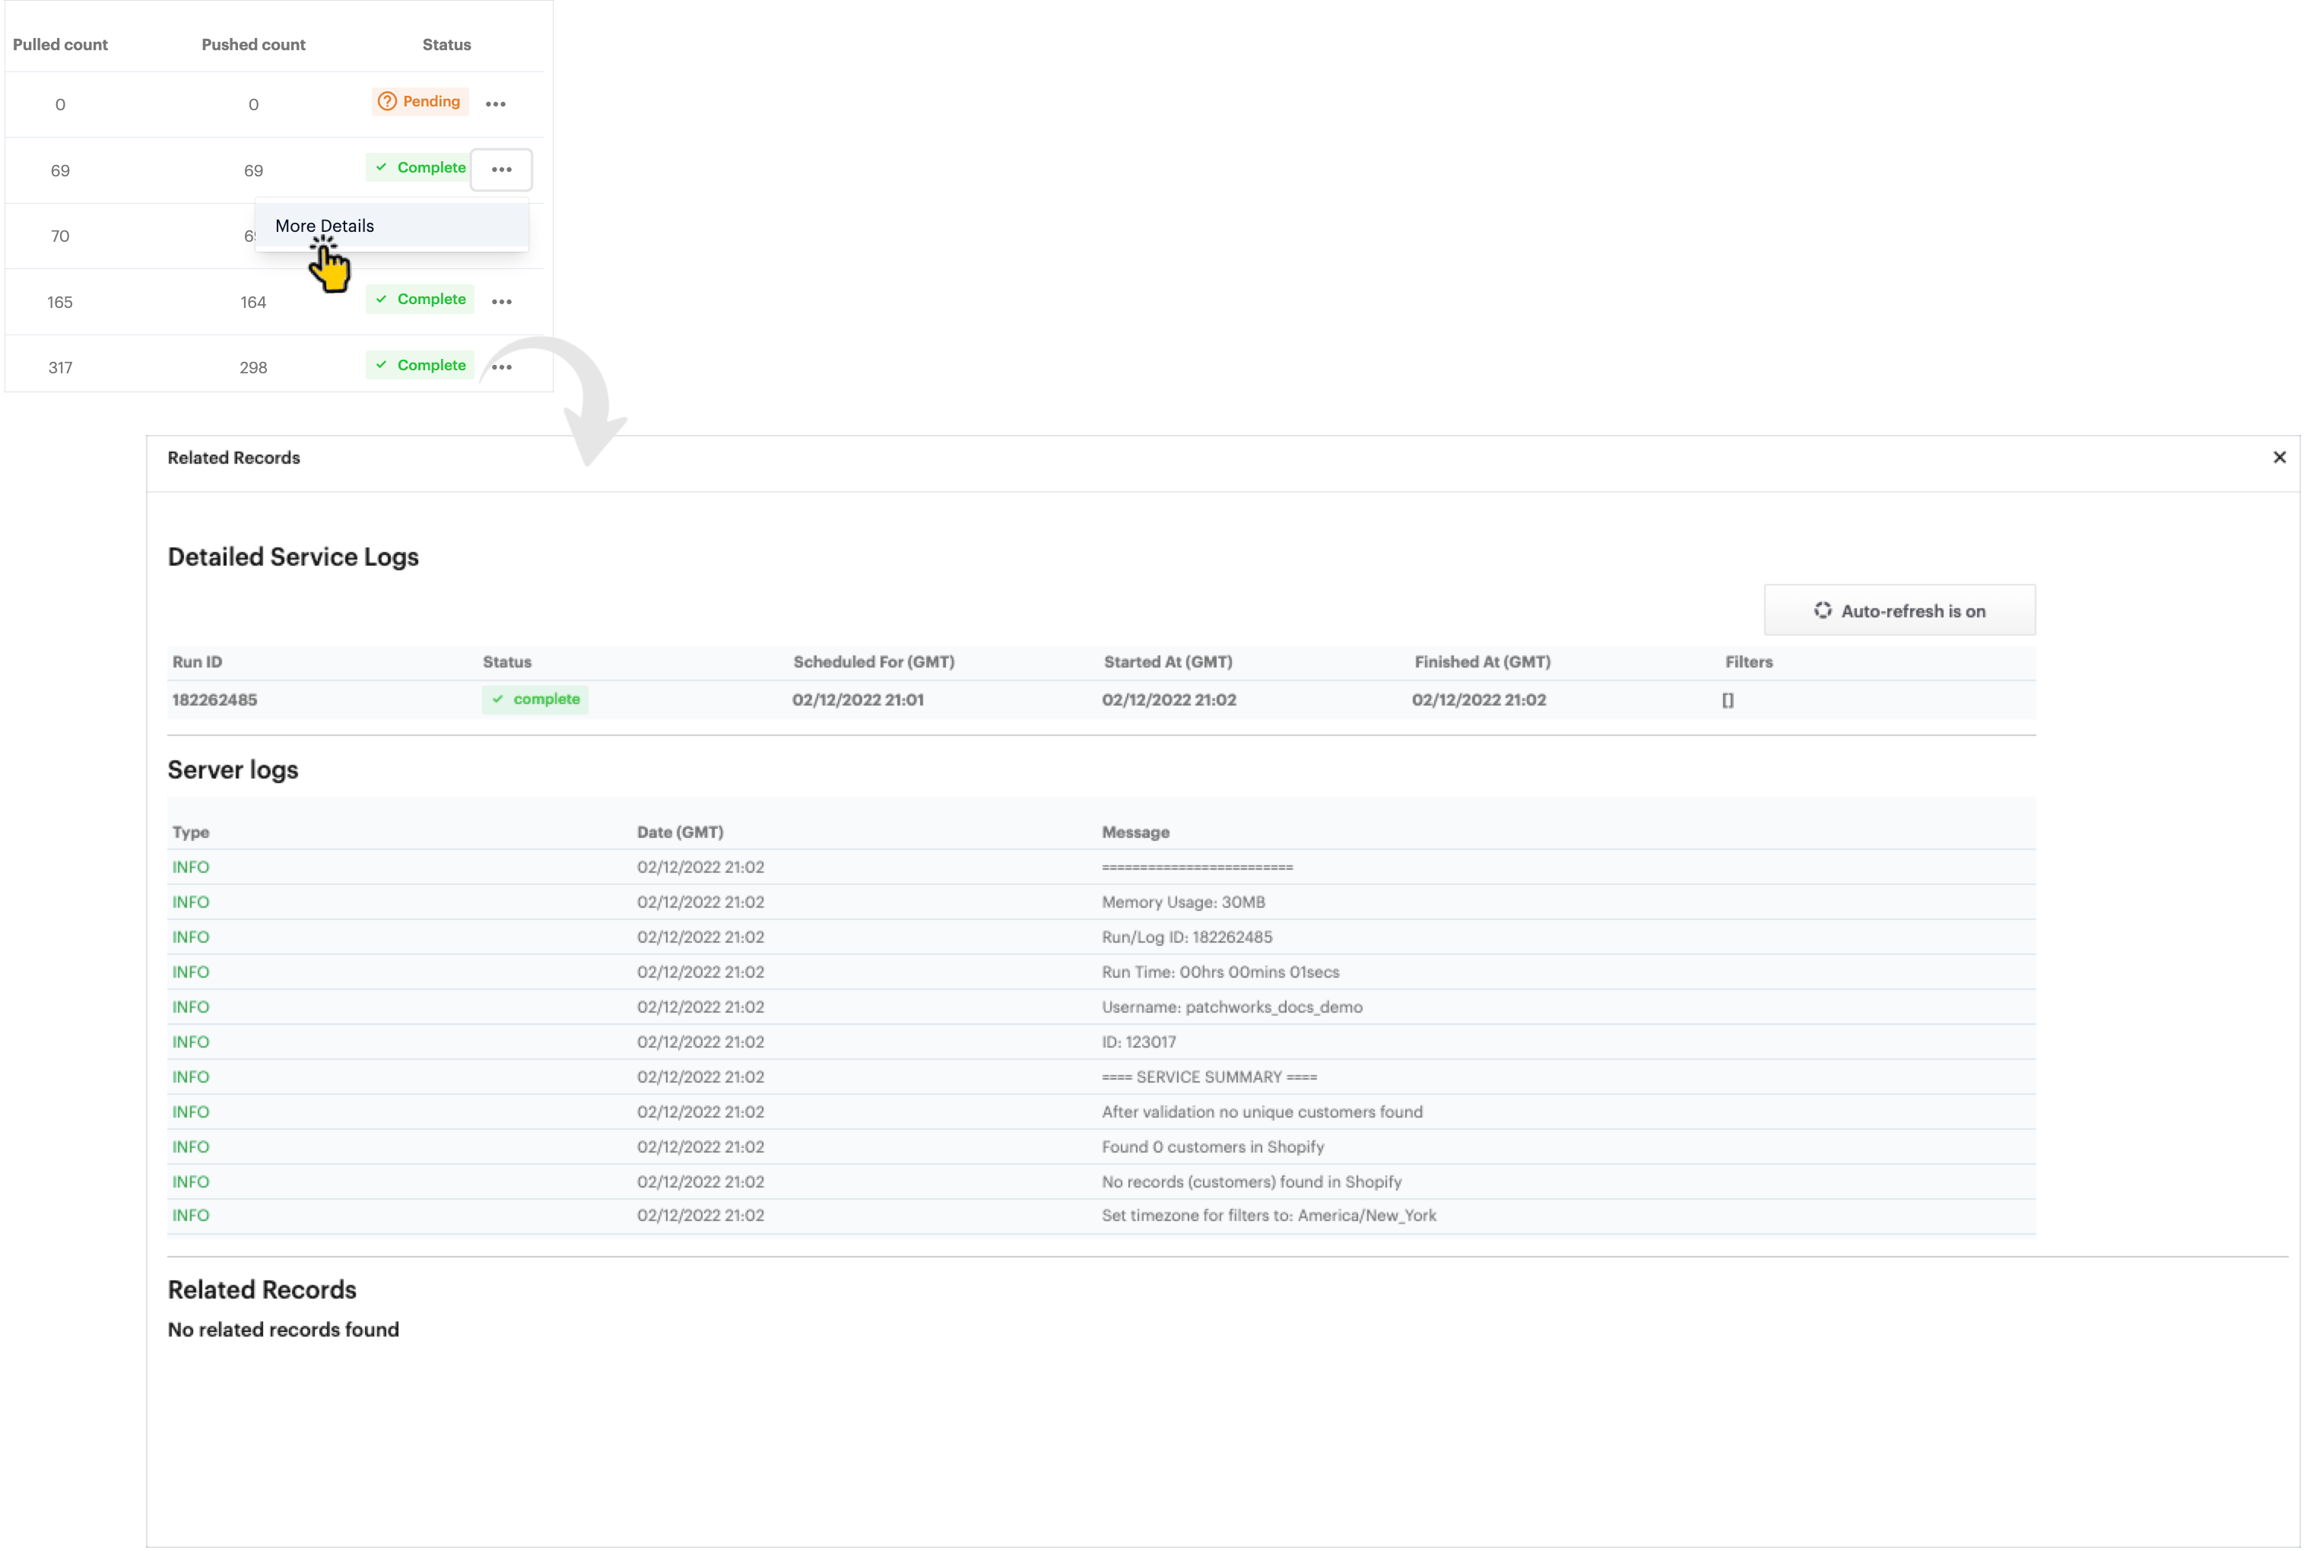
The sync list shows summary information for every sync (i.e. service run) that has started in the last 24 hours - for example:
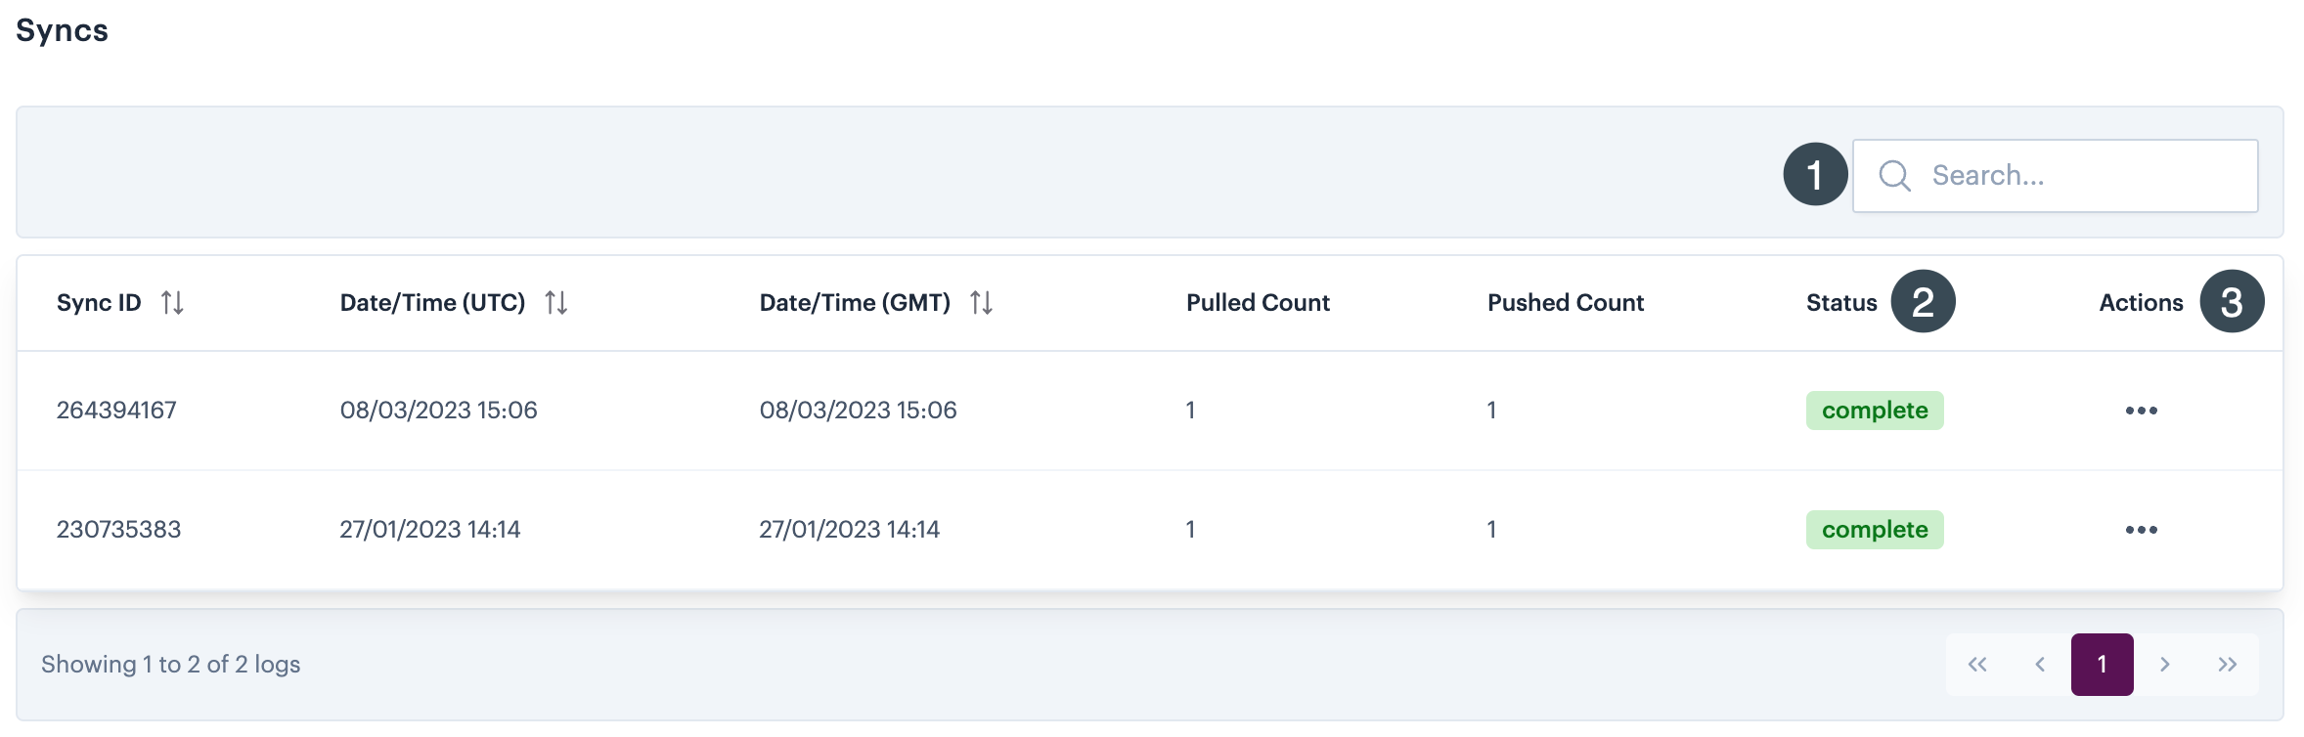
You can use the search field (see 1 above) to find a particular sync entry by its sync id. You can also see the current status (see 2 above) and click the ellipsis (see 3 above) to access more detailed logs.