Working with run logs
Last updated
Last updated
Having accessed the run logs & queue page, the active tab displays active and previous process flow runs - these are listed chronologically based on the run start time:
At a glance, you can see the outcome of a run, the start date/time, the duration, how the run was triggered and whether there were any warnings.
Failed runs are shown with an expandable summary of why the run failed, and you can also access additional options to access detailed logs, and more.
Click the name of a process flow to access its setup.
If a process flow is running it is displayed with a 'stop' button that you can use to stop the run.
Run logs are retained for 7 days.
Payloads are retained for 72 hours.
Payloads are stored in AWS S3 (eu-west-2 London).
Payloads are encrypted during pull/push operations (HTTPS, TLS 1.2/1.3).
There is a limit on the number of process flow runs that can be started per minute. This limit varies according to your subscription tier - please see Core subscription tiers for information.
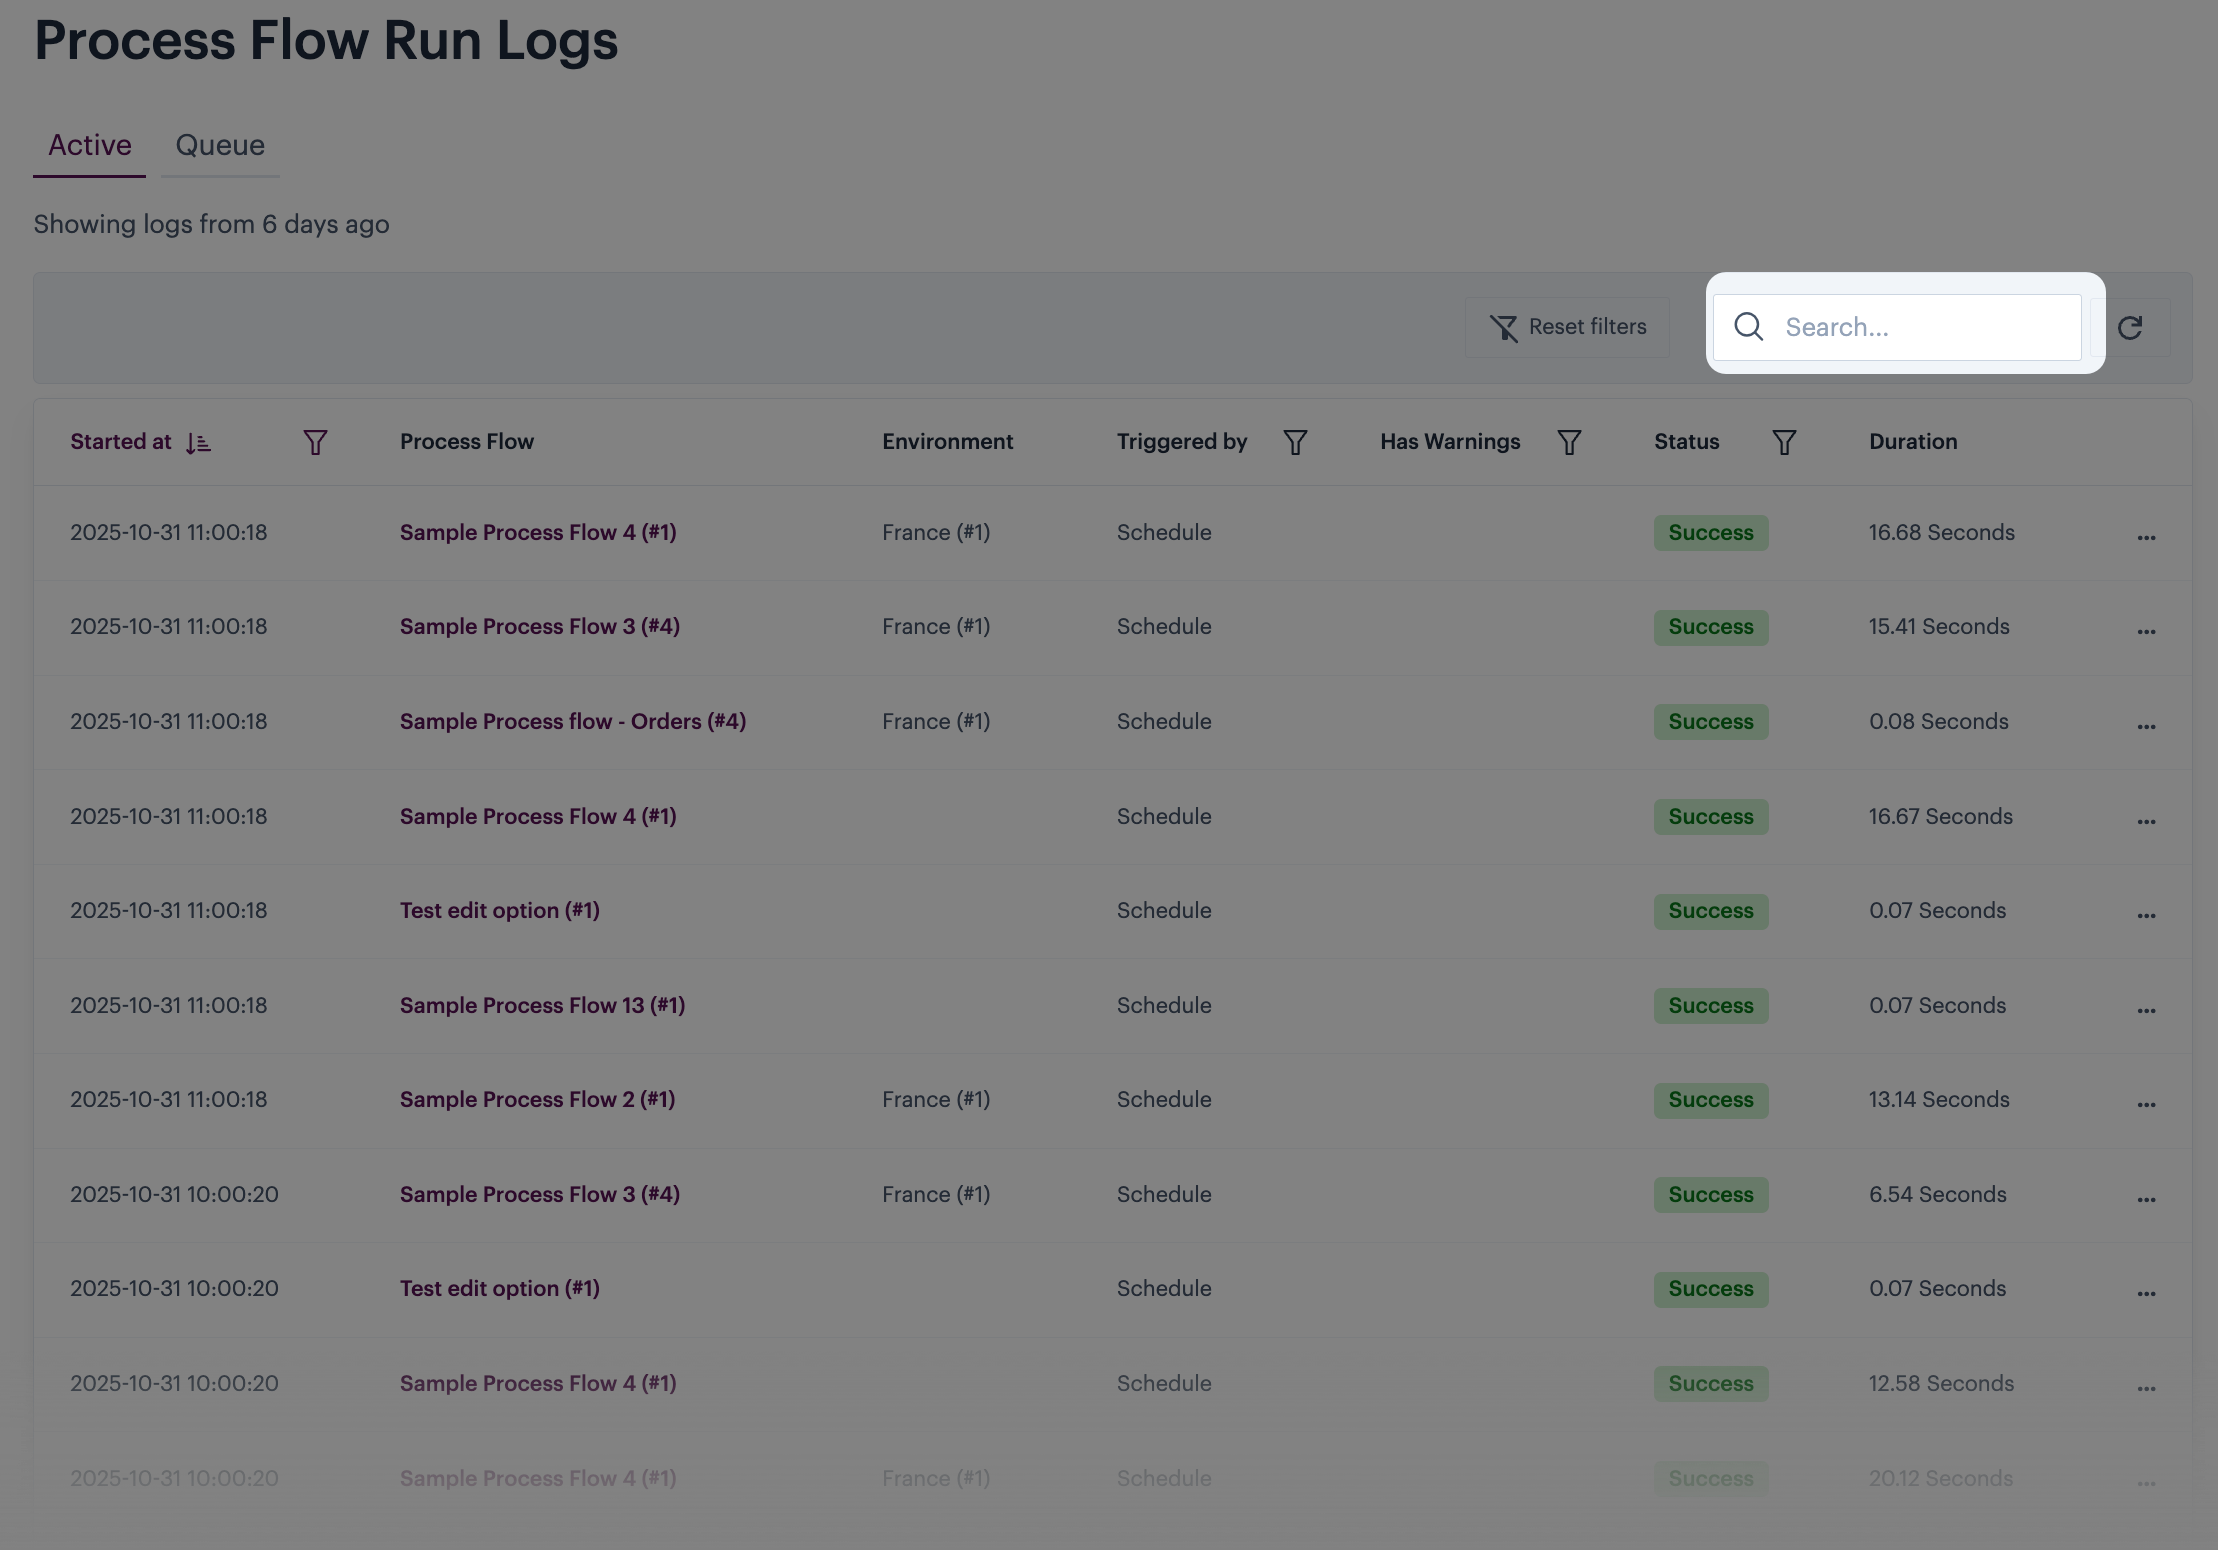
If you're looking for a specific log, you can use the search field to search by flow run id or by process flow name:
If you want to find logs for a specific flow run id, type the full id into the search field - for example:
You must enter the id in full - partial elements are not matched.
A flow run id search is not case sensitive - entering 01j6errxr432r4k4dh41y5ttpc
is the same as 01J6ERRXR432R4K4DH41Y5TTPC
or 01J6eRRxR432r4K4DH41Y5ttPC
.
If you want to find logs for a process flow that you only know by name, type any part of the name into the search field - for example:
You can enter as much or as little of the name as you like.
A flow name search is not case sensitive - entering CHECK
is the same as check
or Check
.
By default, logs are displayed for the last seven days. You can change this using the associated date filter - here, you can clear all filters to show all available logs, or add rules to apply a new date/time range:
Use filters to refine the list based on the value associated with a particular column. Currently, you can filter logs by:
Started at date
Trigger (schedule, manual, API, etc.)
Has warnings
Status
To define a filter, click the filter icon associated with a column - for example:
...then make selections from the options provided - for example:
The date filter displays date/time rule pickers:
The show stats option can be toggled ON to view additional columns in the log table:
When this option is toggled ON, three more columns are shown - these show insights for the performance of the process flow.
Further insights are available from the logs associated with each run, and also from your company insights page.
The status of a run will be one of the following:
Status | Summary |
---|---|
Success | The process run was completed success without errors. |
Partial success | The process flow run was completed successfully however at least one failed payload was removed. |
Failed | The process run did not complete due to errors. |
Retried | The failed run has been retried. |
Stopped | The process flow was stopped manually. |
Running | The process flow is currently running. |
If warnings are given during a run (be it failed or successful), the entry is shown with an icon in the Has warnings column - for example:
If the run failed, you should view associated logs to check these warnings, then make any changes necessary to your process flow. If the run succeeded, you should still view the logs for warnings in case the issue causes a failure in the future.
Run logs can contain a lot of information and there may be times when you want to quickly check why a run has failed.
When a process flow run is initialised but fails somewhere in the run, its status is set to failed and an expandable arrow is shown to the left of the entry - click this arrow to view a summary of why the failure occurred. For example:
Each log entry has an ellipses icon, with access to additional options:
From here you can:
View logs. Access more insights and detailed logs for this run. For more information please see our viewing logs page.
View logs (classic). If you prefer to work with 'original style' logs, you can access them from here. For more information please see our viewing logs (classic) page.
Download logs. Use this option to download detailed logs in CSV format. For more information please see our downloading run logs page.
Retry the flow run. Use this option to retry a process flow run that previously failed. For more information please see our retrying a failed process flow run page.
The date filter displays date/time rule pickers: